> ## Documentation Index
> Fetch the complete documentation index at: https://docs.rootly.com/llms.txt
> Use this file to discover all available pages before exploring further.
# Grafana
> Connect Grafana to Rootly to ingest alert events and capture dashboard and panel snapshots during incidents through Genius workflows.
The Grafana integration connects Rootly with your Grafana instance in two directions. Grafana alert rules send events into Rootly as alerts, and incident workflows capture dashboard and panel snapshots so responders keep point-in-time visibility into your metrics without leaving the incident.
With the Grafana integration, you can:
* Receive Grafana alert events as Rootly alerts, routed to services, teams, or escalation policies
* Page Rootly on-call targets directly from Grafana alert rules
* Capture Grafana dashboard and panel snapshots from Genius workflows during incidents
* Attach snapshot links to incident timelines for post-incident review
## Before You Begin
Before setting up the integration, make sure you have:
* A Rootly account with permission to manage integrations
* A Grafana instance accessible over HTTPS
* Permission to create service accounts in Grafana
* Permission to configure contact points and alert rules in Grafana, if you plan to ingest alerts
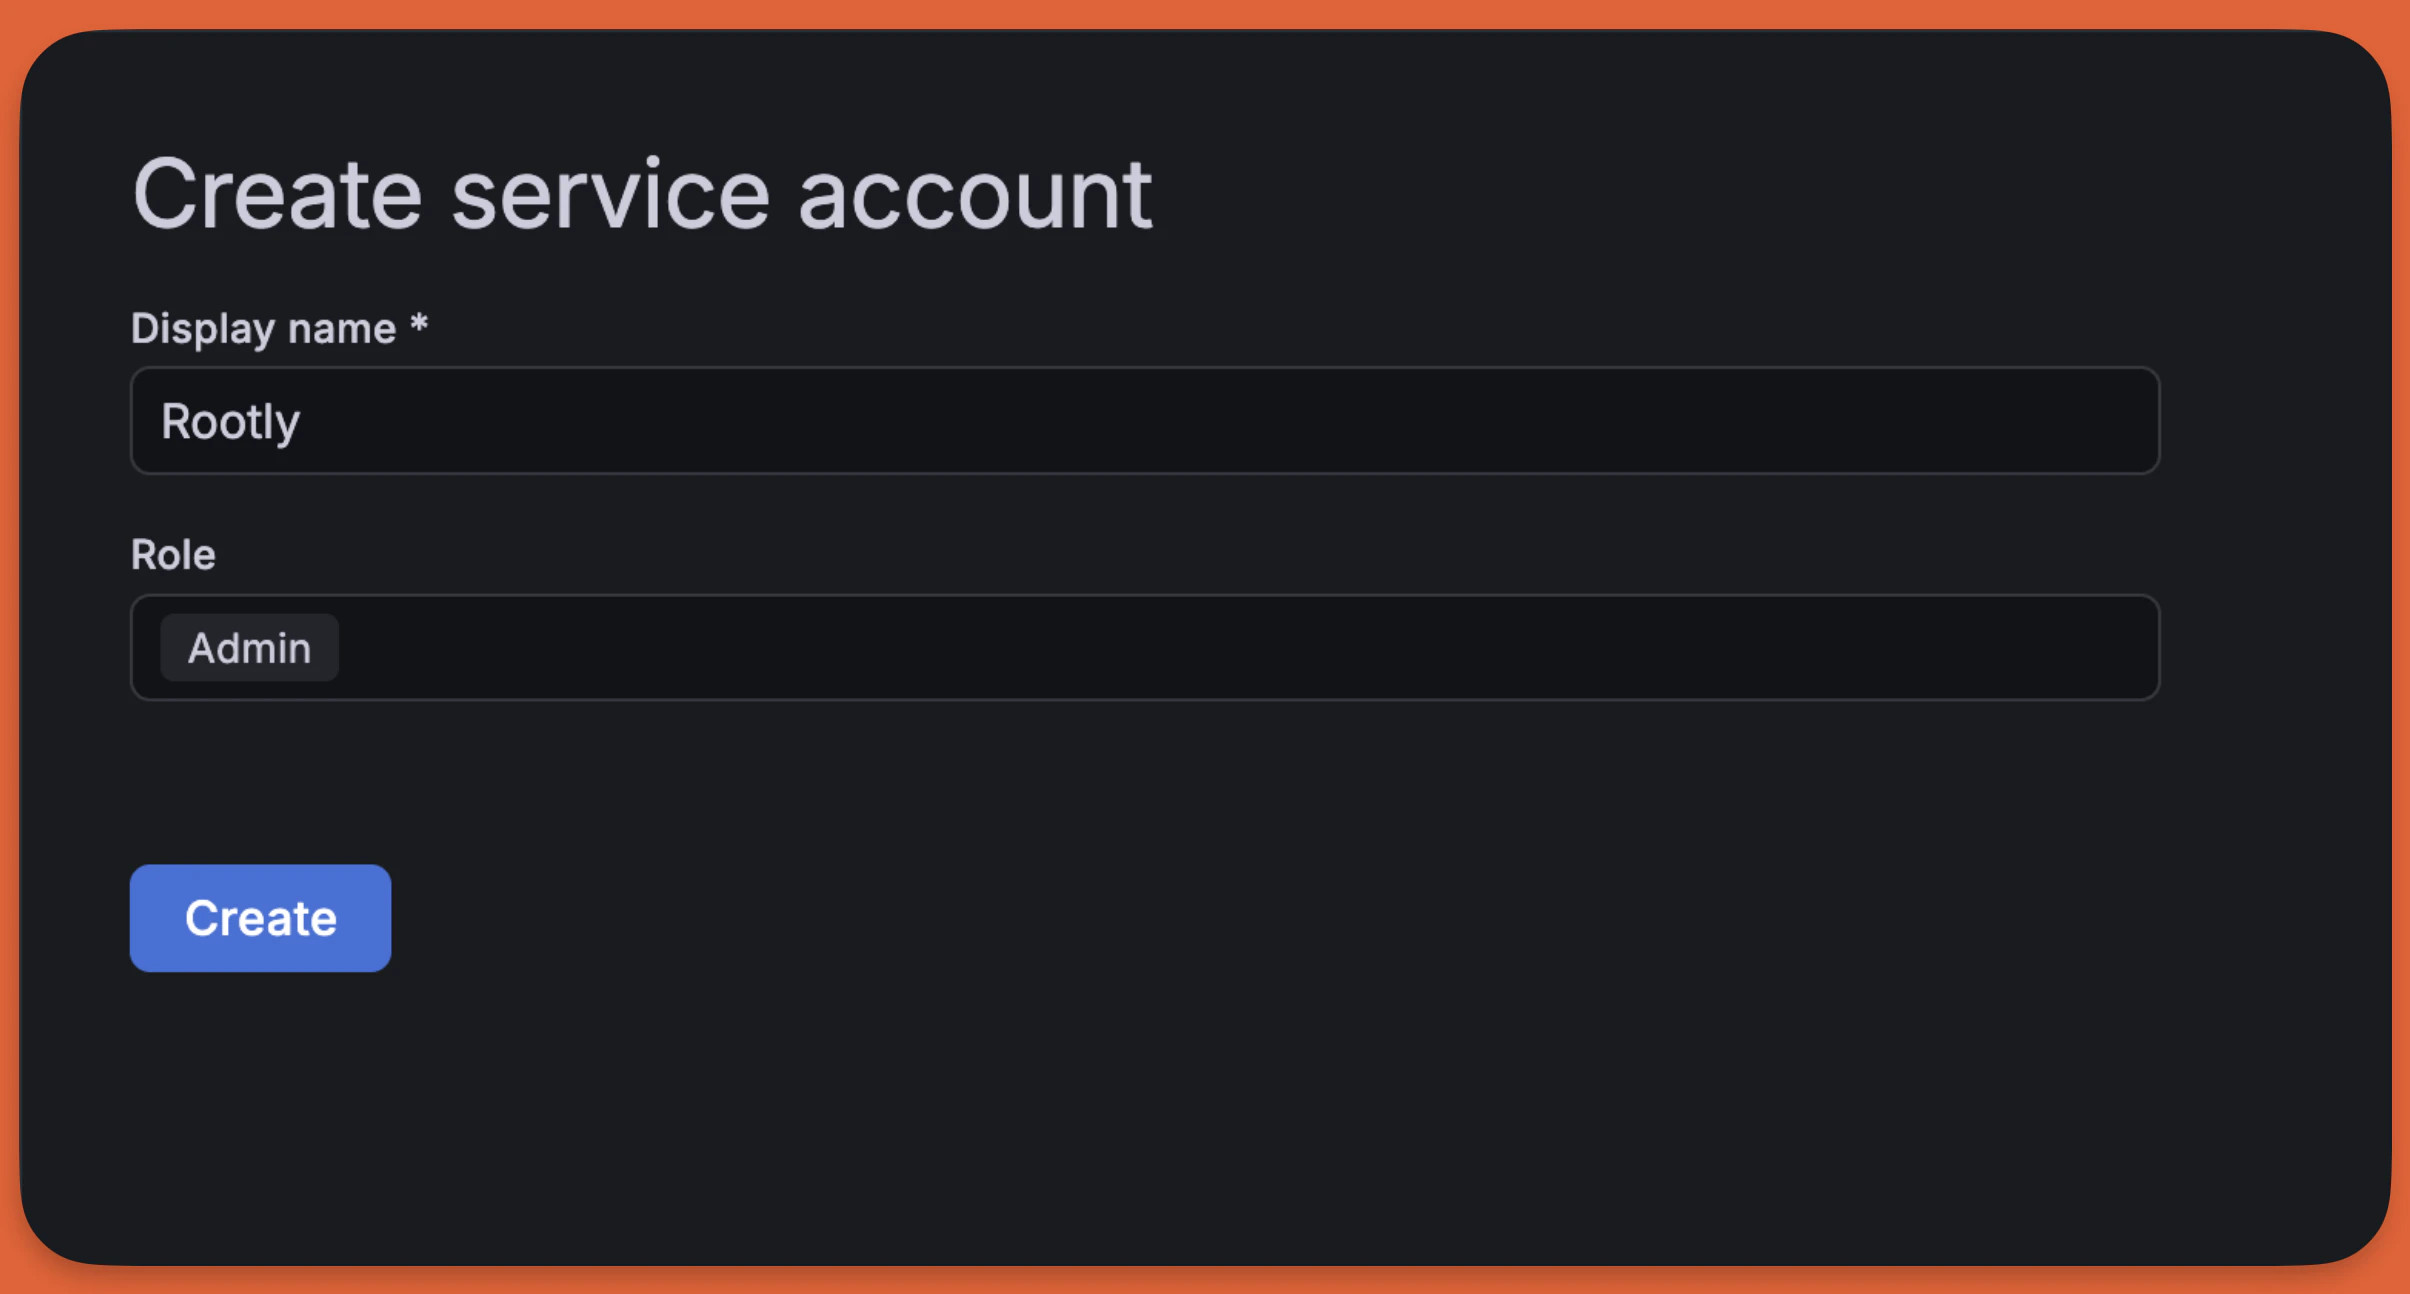
Rootly requires a Grafana service account with an **Admin** role to create dashboard snapshots. Rootly recommends a dedicated service account so the integration does not break if an individual user leaves your organization.
## Installation
Navigate to the integrations page in Rootly and select **Grafana**.
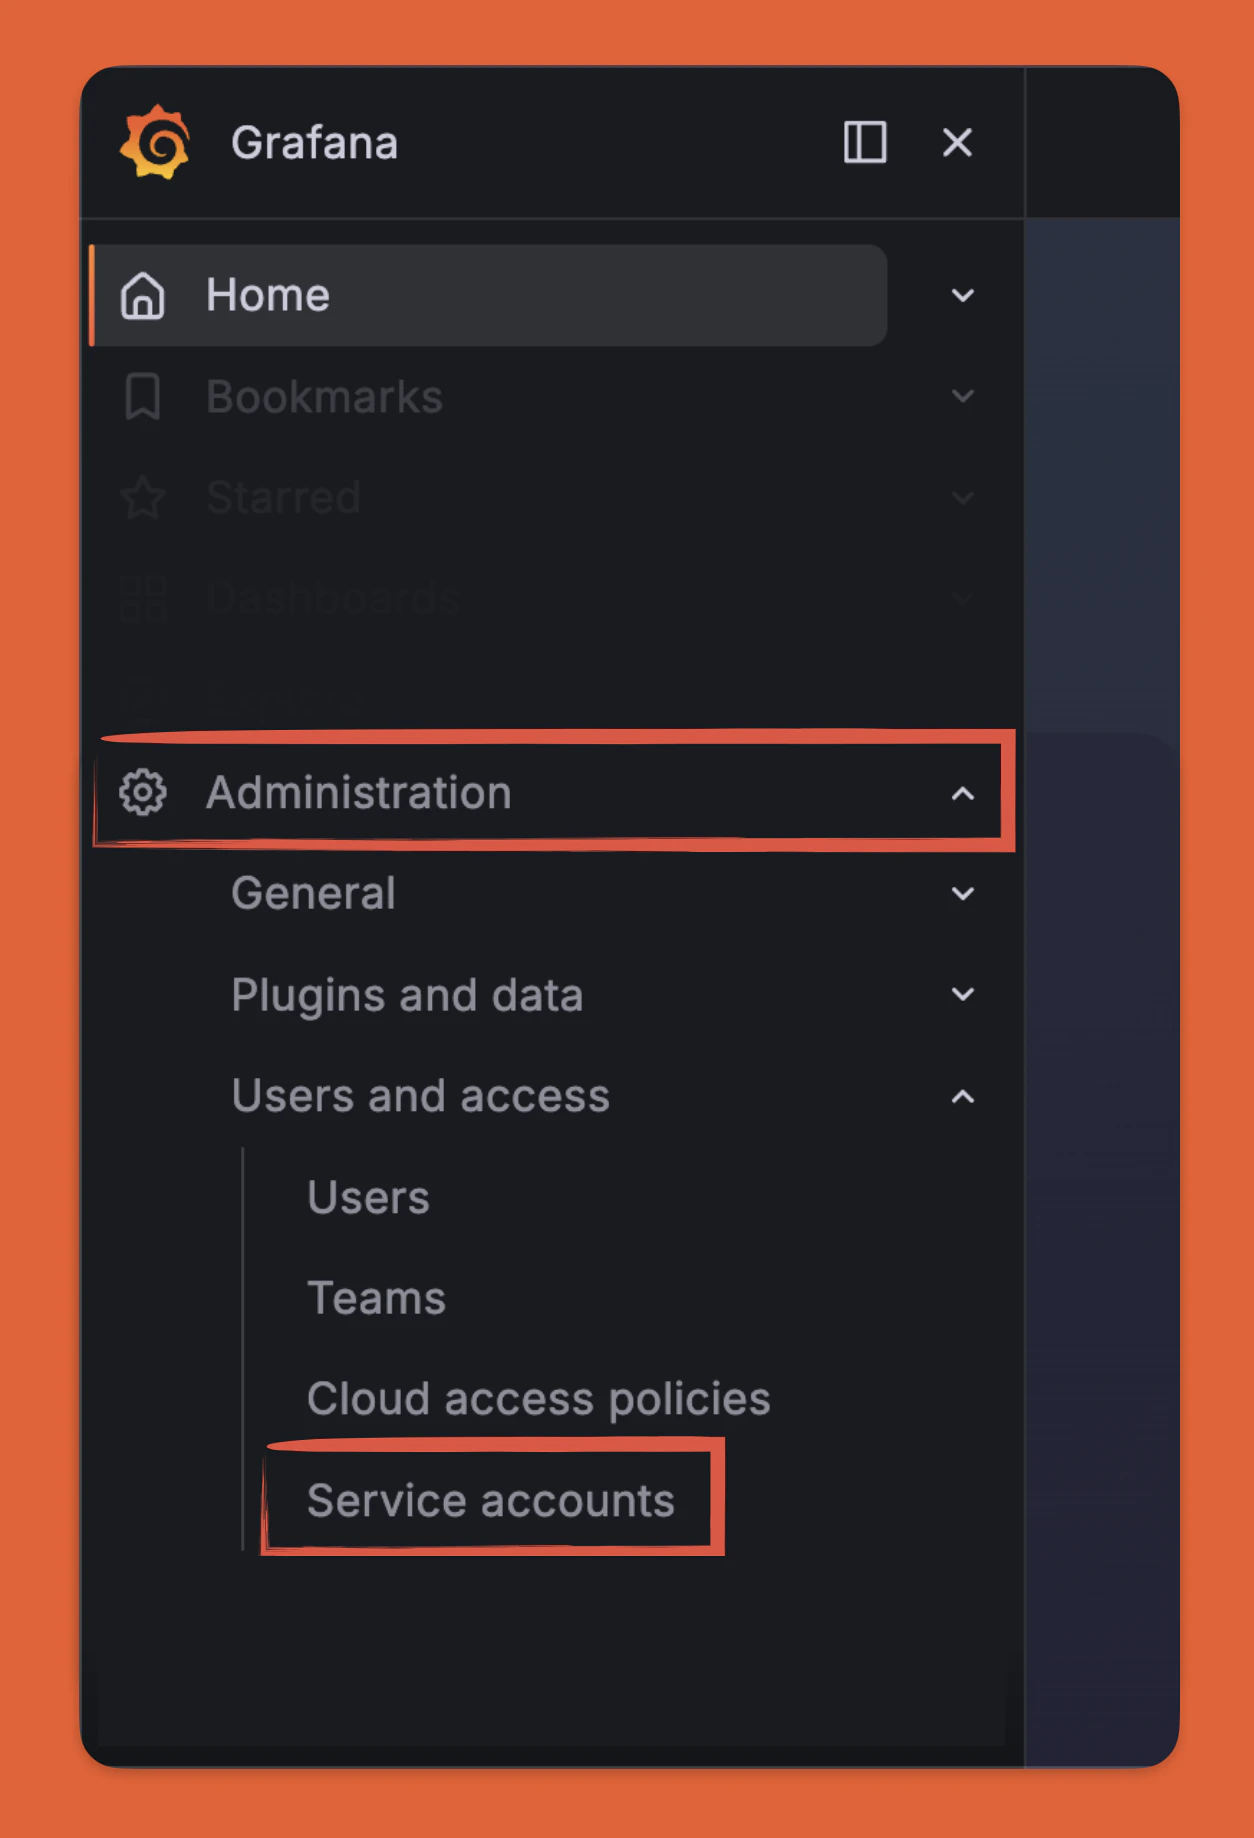
 In your Grafana instance, navigate to **Administration > Service Accounts**.
 Select **Add service account** and create it with an **Admin** role.
 Grafana service accounts with roles lower than Admin cannot create snapshots. The integration will fail silently if the role is insufficient.
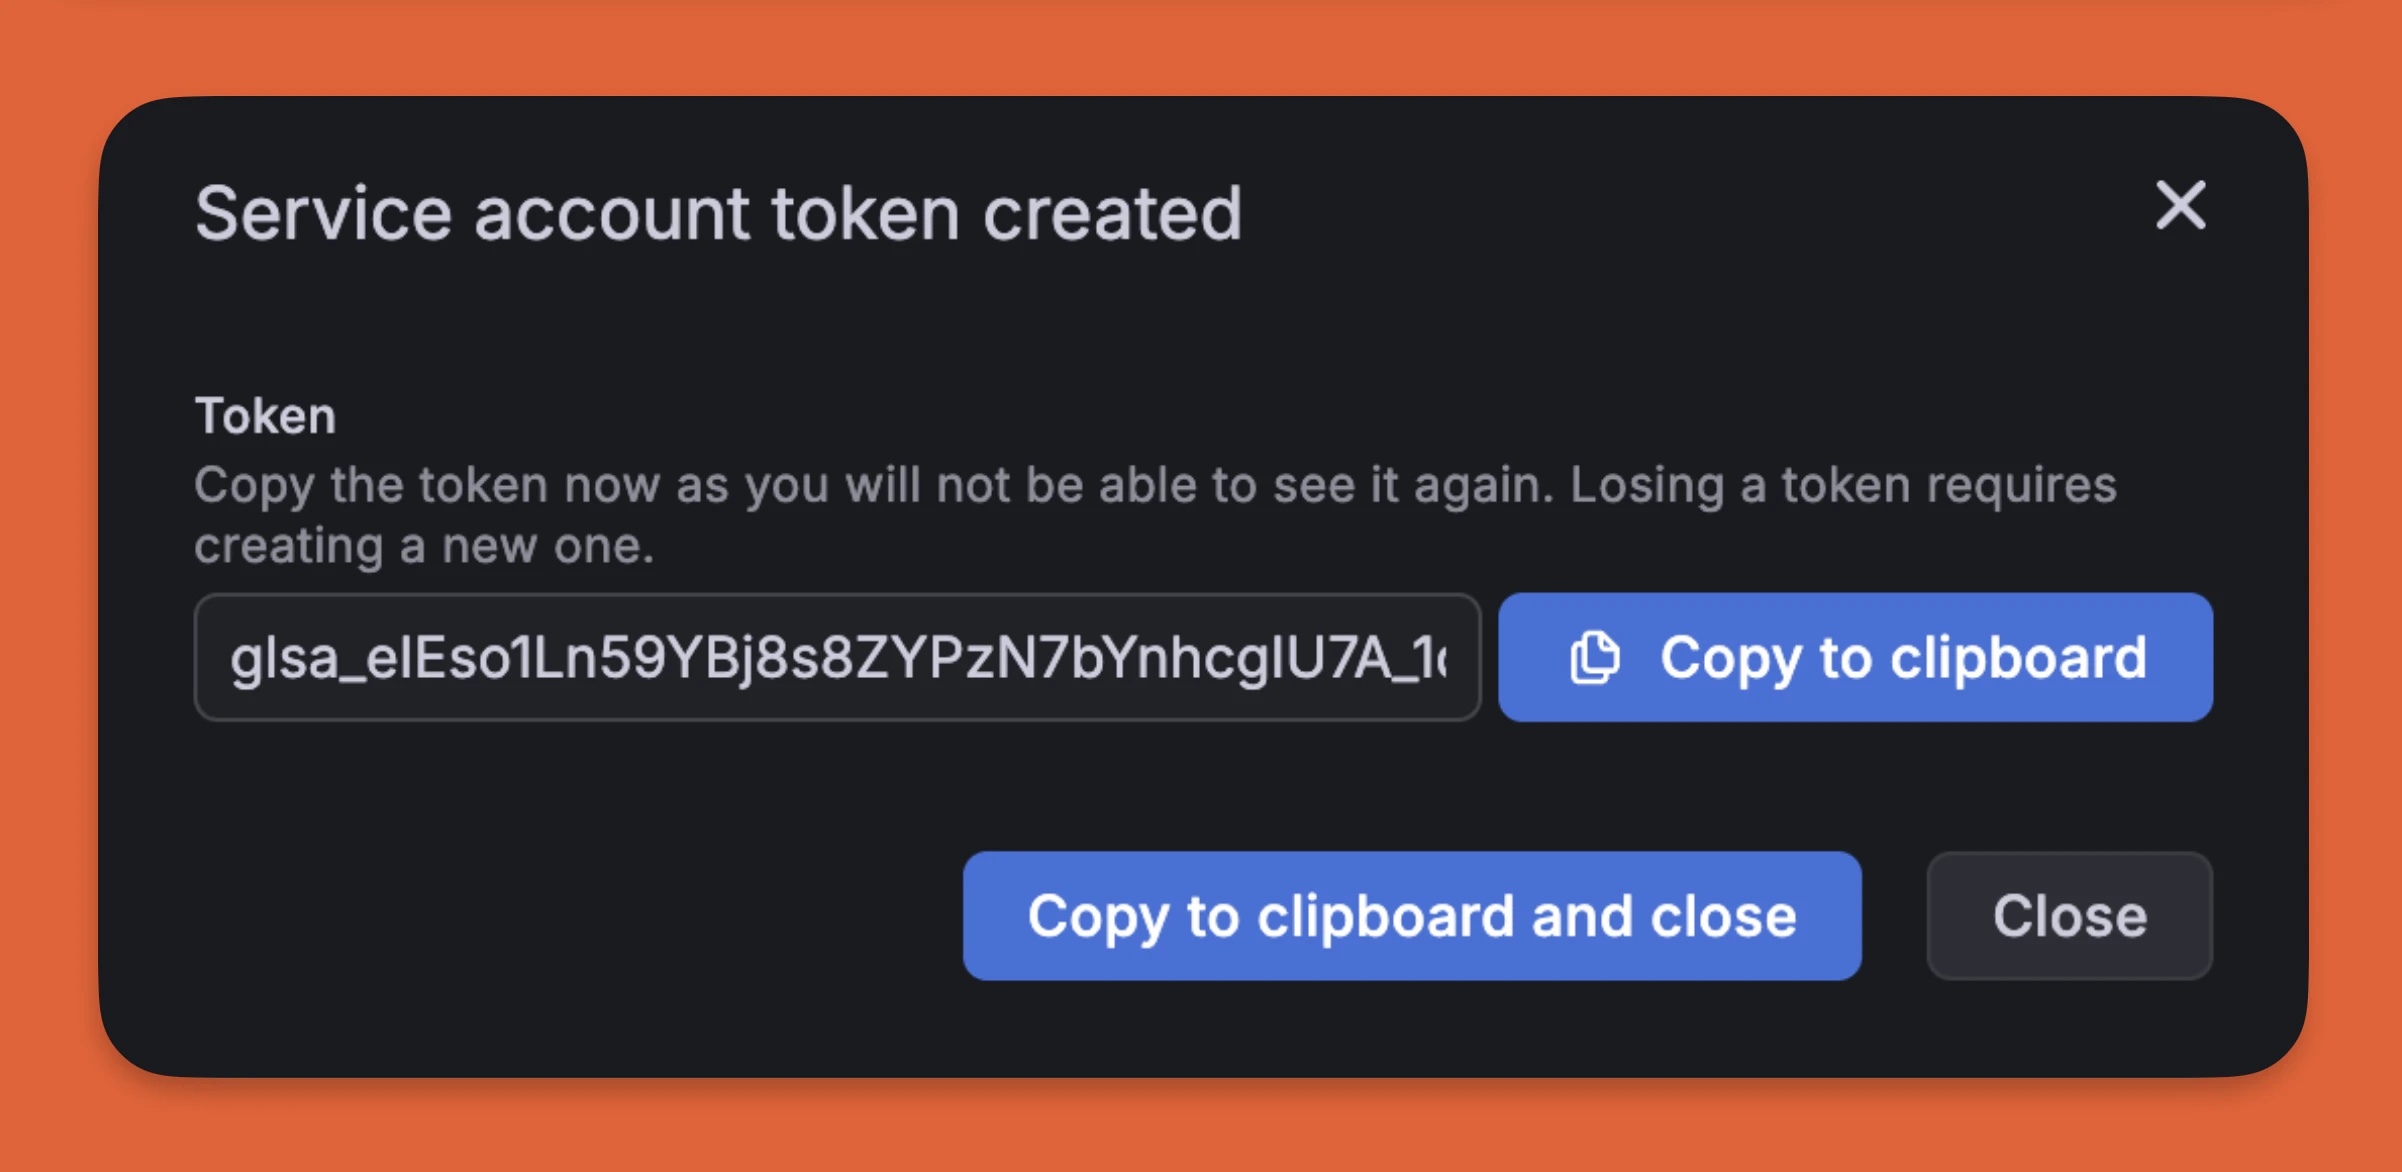
Open the service account and select **Add Service Account token**. Enter a display name, set the token expiration, and generate the token.
Grafana service accounts with roles lower than Admin cannot create snapshots. The integration will fail silently if the role is insufficient.
Open the service account and select **Add Service Account token**. Enter a display name, set the token expiration, and generate the token.
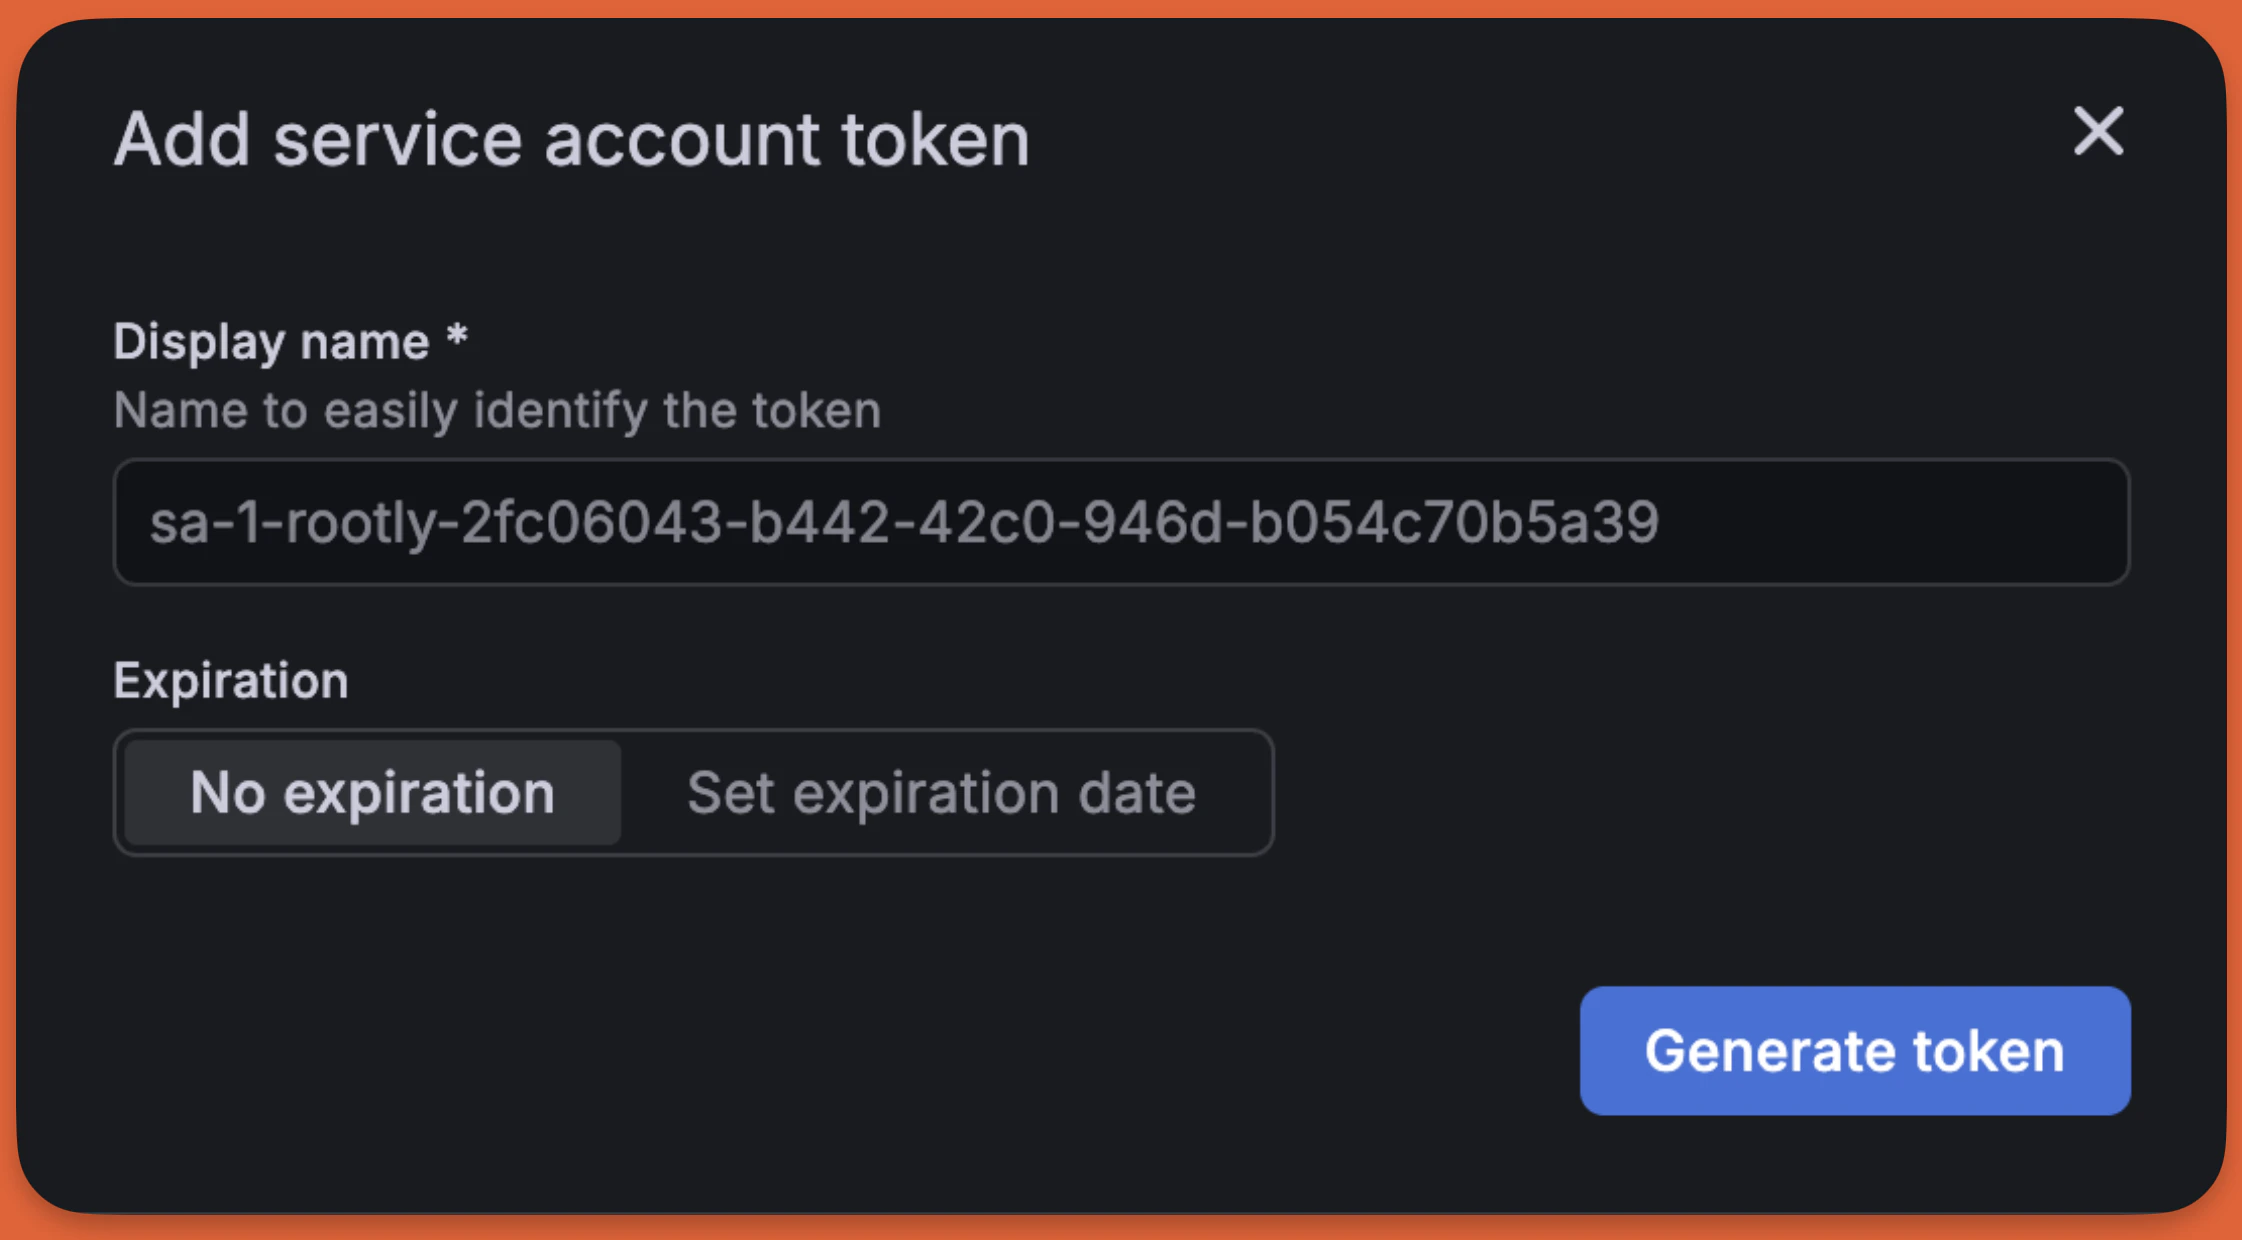 Copy the token immediately — Grafana will not show it again after you leave this page.
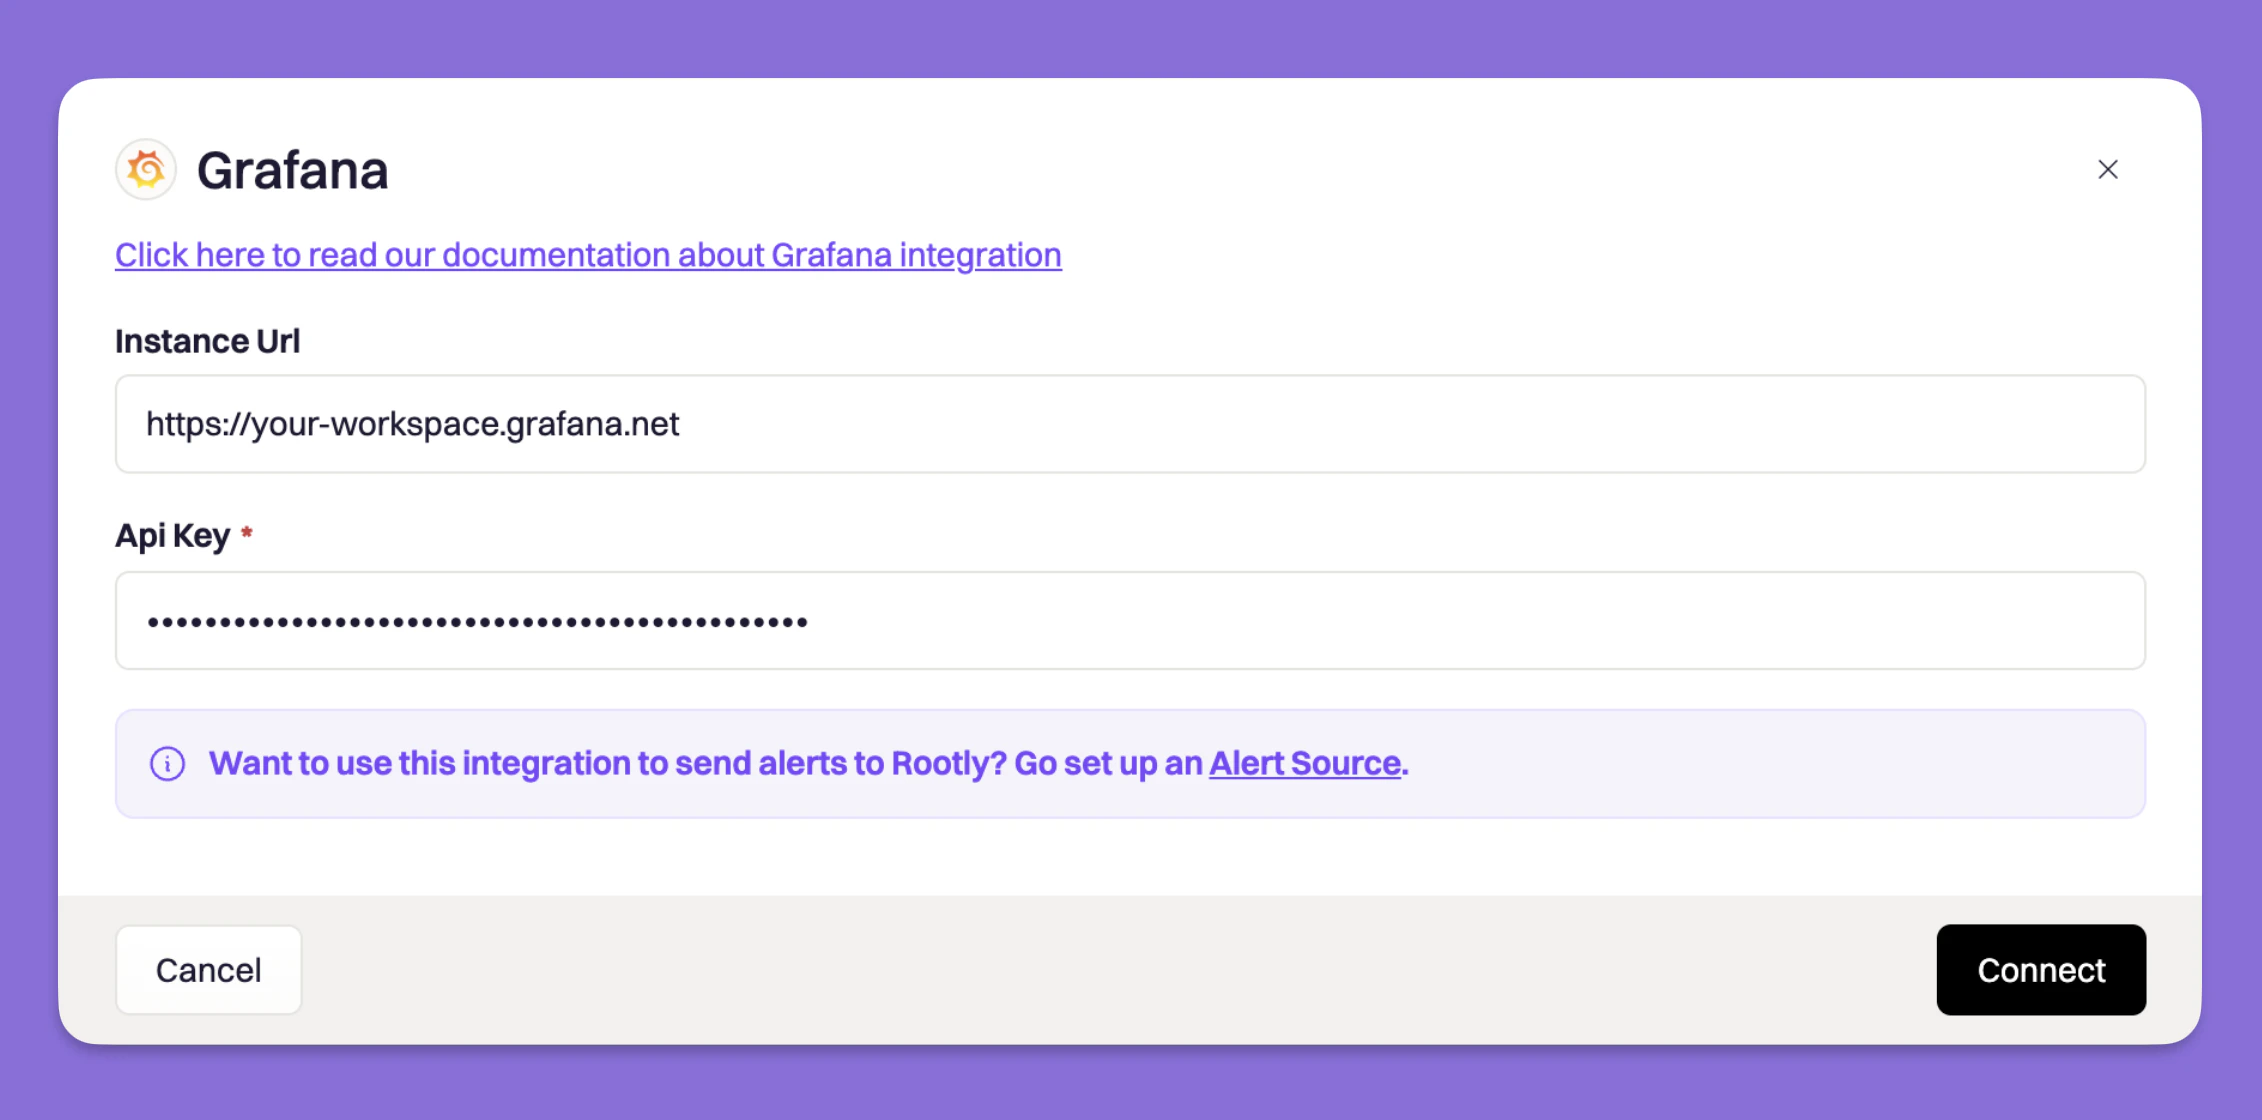
 Enter your Grafana **instance URL** and the **service account token** into the Rootly integration settings and save.
The instance URL must use HTTPS. HTTP URLs are not accepted.
Enter your Grafana **instance URL** and the **service account token** into the Rootly integration settings and save.
The instance URL must use HTTPS. HTTP URLs are not accepted.
 ## Ingest Grafana Alerts
Grafana sends alert events into Rootly through a webhook contact point. Once alerts are flowing, alert workflows can create incidents, notify Slack channels, or page on-call targets.
Install the integration before configuring the contact point. The webhook secret is generated during installation and is required for authentication.
### Configure a Webhook Contact Point
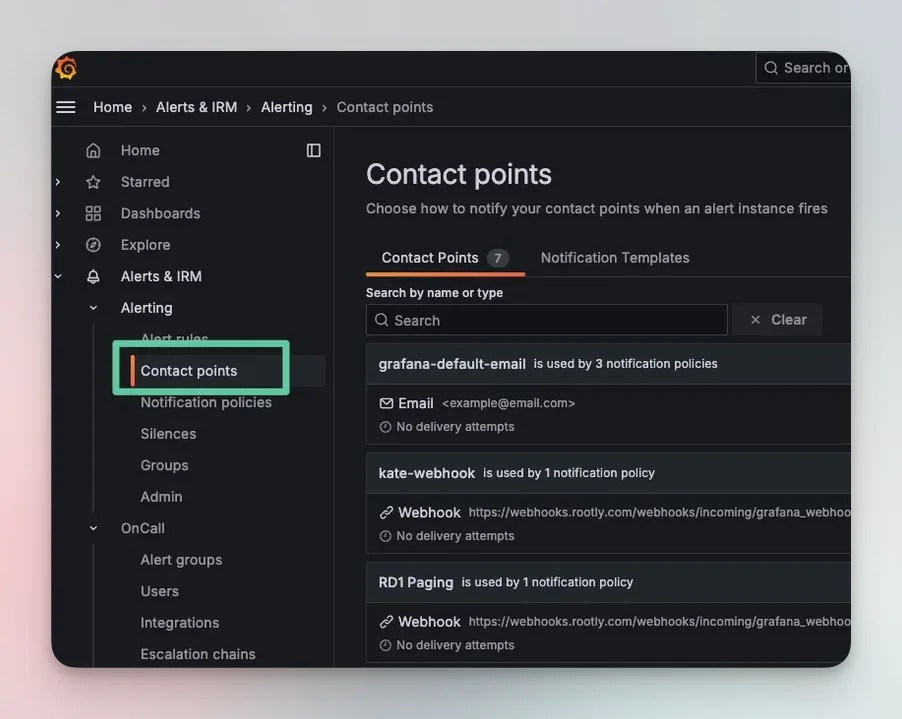
Log into your Grafana instance and navigate to **Alerting > Contact points**.
## Ingest Grafana Alerts
Grafana sends alert events into Rootly through a webhook contact point. Once alerts are flowing, alert workflows can create incidents, notify Slack channels, or page on-call targets.
Install the integration before configuring the contact point. The webhook secret is generated during installation and is required for authentication.
### Configure a Webhook Contact Point
Log into your Grafana instance and navigate to **Alerting > Contact points**.
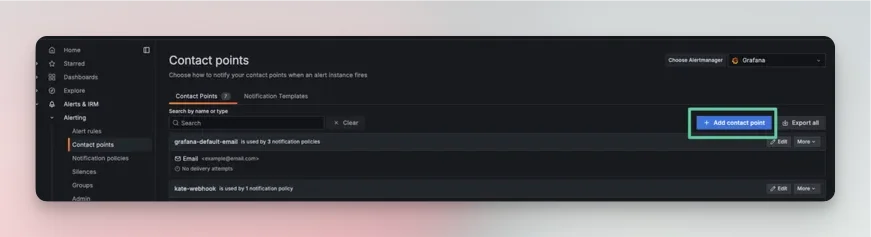
 Select **+ Add contact point**.
 Fill in the contact point details:
* **Name** — give the contact point a descriptive name
* **Integration** — select **Webhook**
* **HTTP Method** — select **POST**
Fill in the contact point details:
* **Name** — give the contact point a descriptive name
* **Integration** — select **Webhook**
* **HTTP Method** — select **POST**
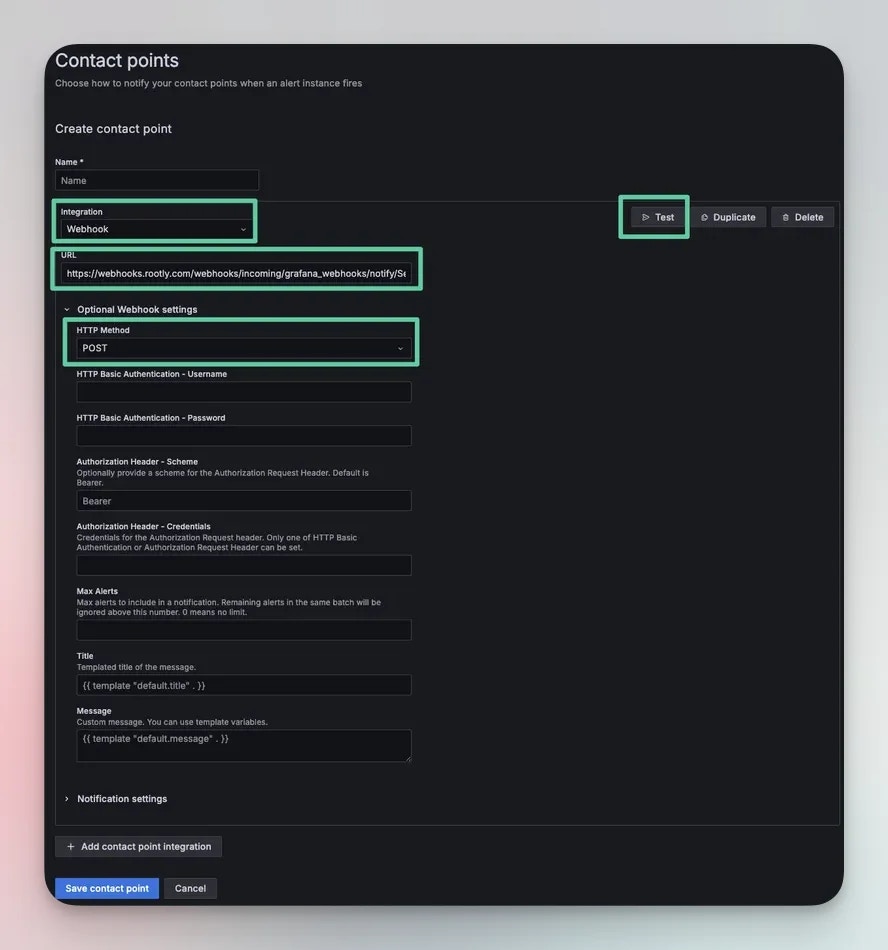 The URL format depends on whether you want a general alert or want to page an on-call target.
**For a general alert** (appears in Rootly Alerts, does not page anyone):
```text theme={null}
https://webhooks.rootly.com/webhooks/incoming/grafana_webhooks/?secret=
```
The URL format depends on whether you want a general alert or want to page an on-call target.
**For a general alert** (appears in Rootly Alerts, does not page anyone):
```text theme={null}
https://webhooks.rootly.com/webhooks/incoming/grafana_webhooks/?secret=
```
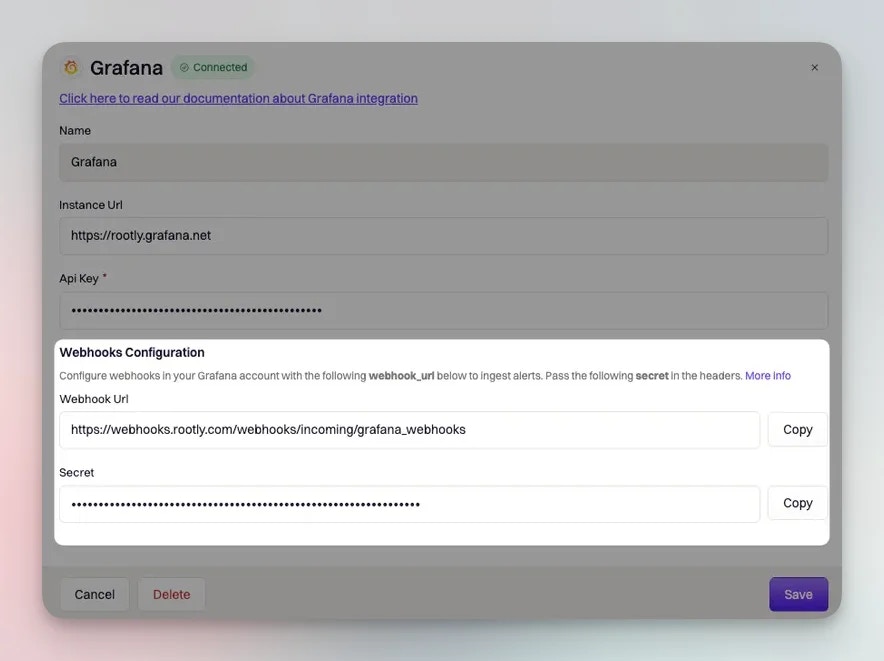 **To page a Rootly on-call target**, append a notification target to the URL:
```text theme={null}
https://webhooks.rootly.com/webhooks/incoming/grafana_webhooks/notify//?secret=
```
Supported resource types are `User`, `Group` (team), `EscalationPolicy`, and `Service`. The resource ID can be found by editing the resource in Rootly.
**To page a Rootly on-call target**, append a notification target to the URL:
```text theme={null}
https://webhooks.rootly.com/webhooks/incoming/grafana_webhooks/notify//?secret=
```
Supported resource types are `User`, `Group` (team), `EscalationPolicy`, and `Service`. The resource ID can be found by editing the resource in Rootly.
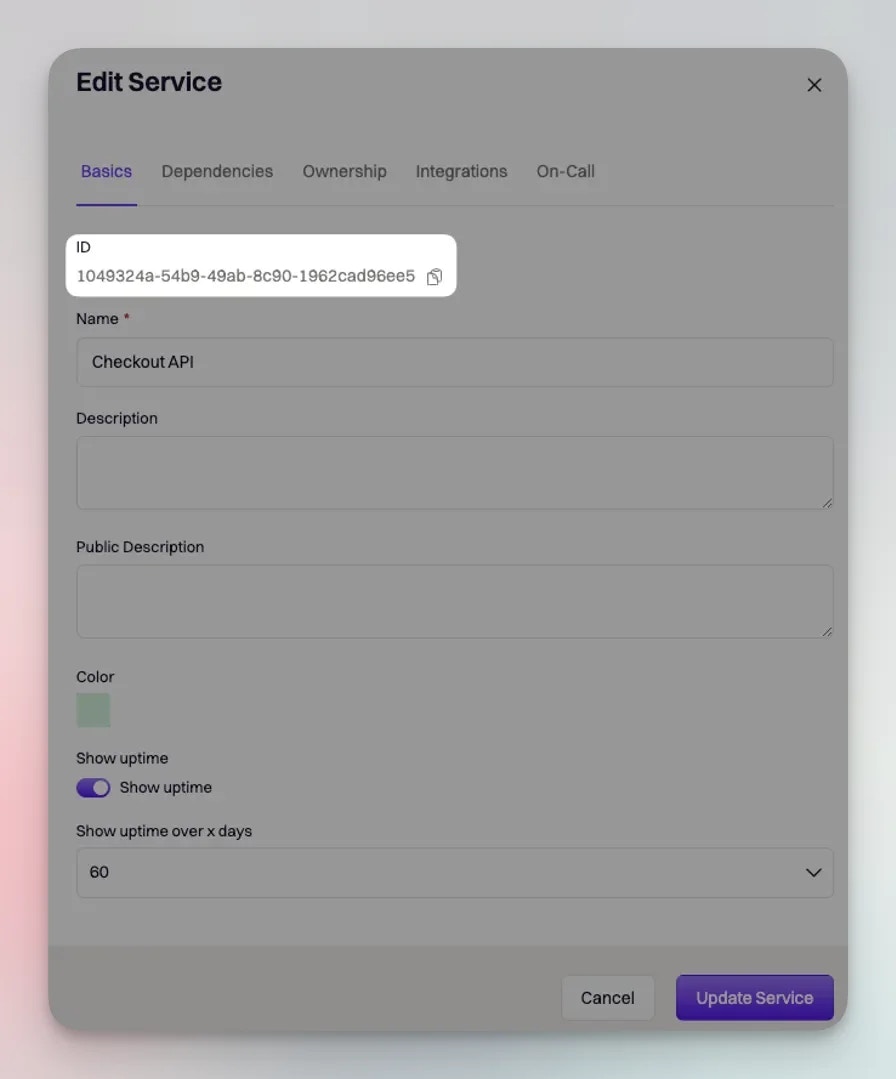 Your webhook URL and secret are available in Rootly under **Integrations > Grafana > Configure**.
Select **Test** to send a test alert to Rootly. A test alert should appear on your [Rootly Alerts page](https://rootly.com/account/alerts).
Your webhook URL and secret are available in Rootly under **Integrations > Grafana > Configure**.
Select **Test** to send a test alert to Rootly. A test alert should appear on your [Rootly Alerts page](https://rootly.com/account/alerts).
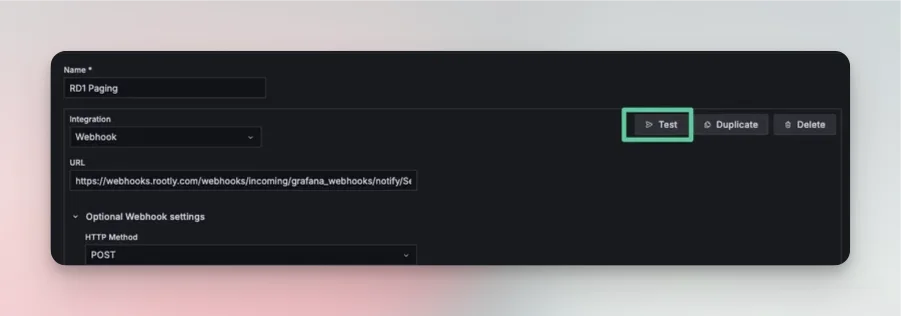 Once the test succeeds, select **Save contact point**.
### Attach the Contact Point to Alert Rules
A contact point only receives alerts when it is attached to an active alert rule.
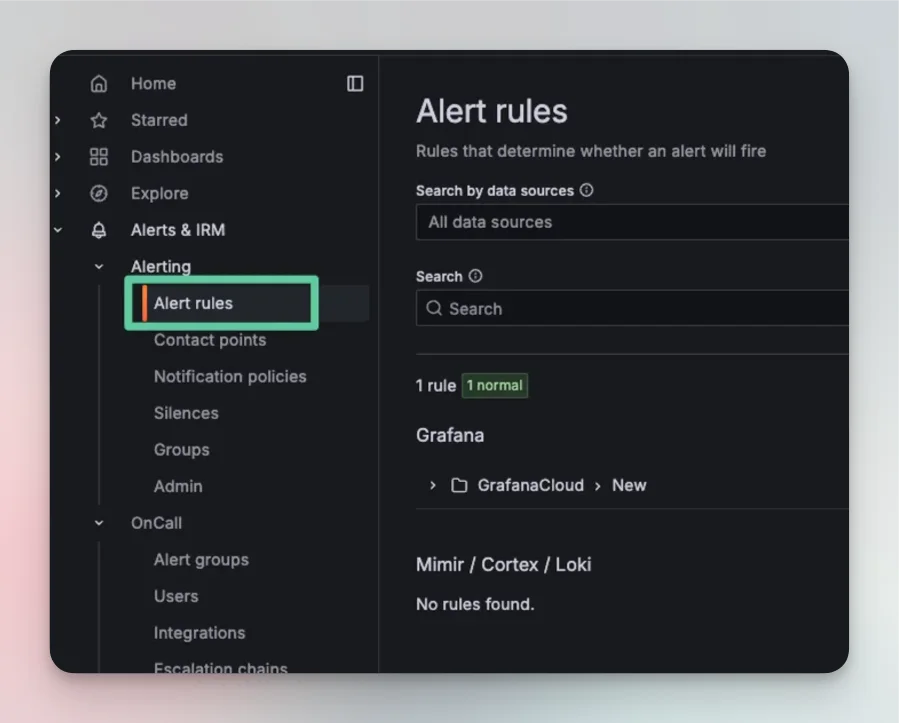
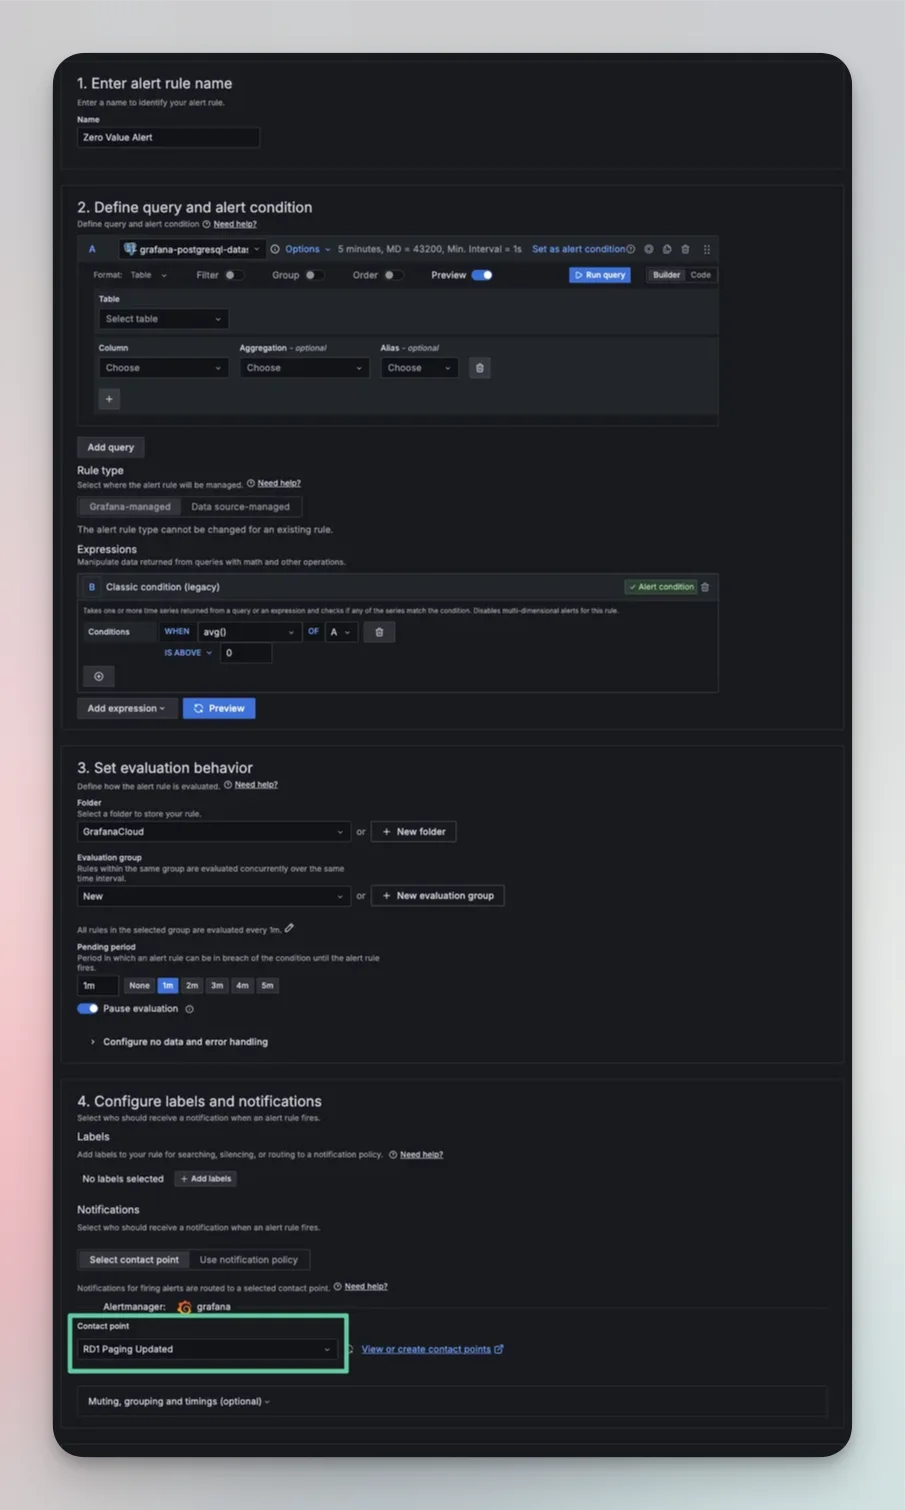
Navigate to **Alerting > Alert rules** and select **+ New alert rule**, or edit an existing rule. In the rule configuration, set the **Contact point** to the one you just created.
Once the test succeeds, select **Save contact point**.
### Attach the Contact Point to Alert Rules
A contact point only receives alerts when it is attached to an active alert rule.
Navigate to **Alerting > Alert rules** and select **+ New alert rule**, or edit an existing rule. In the rule configuration, set the **Contact point** to the one you just created.
 You can attach the same Rootly contact point to multiple alert rules. Use different contact point URLs (with different notification targets) to route different rules to different on-call targets.
 ### How Alerts Are Mapped
Rootly extracts the following fields from each Grafana webhook payload:
* **Summary** — the `title` field from the Grafana alert payload
* **External ID** — the `ruleId`, used to deduplicate alerts from the same rule
* **External URL** — the `ruleUrl`, linking back to the Grafana alert rule
* **Labels** — all key-value pairs from `commonLabels` are attached as Rootly alert labels, making them available for routing and filtering
Grafana `commonLabels` map directly to Rootly alert labels. You can use these labels in alert routing rules and workflow conditions to control how different Grafana alerts are handled.
## Workflow Actions
Once the integration is connected, two new tasks are available in your Genius workflows:
* **Capture Grafana Dashboard Snapshot** — captures a snapshot of a full dashboard
* **Capture Grafana Panel Snapshot** — captures a snapshot of a specific panel
Snapshots are point-in-time captures. The snapshot link is attached to the incident timeline so you can reference exactly what your dashboards looked like when the incident occurred.
## Troubleshooting
Confirm the contact point is correctly attached to the alert rule that fired. Verify the webhook URL is correct and the secret matches what is shown in your Rootly Grafana integration settings. Use the **Test** button in the contact point configuration to confirm delivery.
Check that the alert rule is in a firing state and that the contact point is set as the notification destination for that rule. Grafana alert rules that use notification policies rather than direct contact point assignment may route differently than expected.
Verify that the `resource_type` and `resource_id` in the notification target URL are correct and that the resource exists in Rootly. Ensure the resource type is one of `User`, `Group`, `EscalationPolicy`, or `Service`.
Confirm the Grafana service account has the **Admin** role — lower roles cannot create snapshots and the workflow task fails silently. Check that the instance URL uses HTTPS and that the service account token has not expired.
## Uninstall
To remove the Grafana integration, open the integrations panel in Rootly and select **Configure > Delete**.
## Related Resources
* [Alert workflows](/workflows/alert-workflows)
* [Alert routing](/alerts/alert-routing)
* [Integrations overview](/integrations/overview)
### How Alerts Are Mapped
Rootly extracts the following fields from each Grafana webhook payload:
* **Summary** — the `title` field from the Grafana alert payload
* **External ID** — the `ruleId`, used to deduplicate alerts from the same rule
* **External URL** — the `ruleUrl`, linking back to the Grafana alert rule
* **Labels** — all key-value pairs from `commonLabels` are attached as Rootly alert labels, making them available for routing and filtering
Grafana `commonLabels` map directly to Rootly alert labels. You can use these labels in alert routing rules and workflow conditions to control how different Grafana alerts are handled.
## Workflow Actions
Once the integration is connected, two new tasks are available in your Genius workflows:
* **Capture Grafana Dashboard Snapshot** — captures a snapshot of a full dashboard
* **Capture Grafana Panel Snapshot** — captures a snapshot of a specific panel
Snapshots are point-in-time captures. The snapshot link is attached to the incident timeline so you can reference exactly what your dashboards looked like when the incident occurred.
## Troubleshooting
Confirm the contact point is correctly attached to the alert rule that fired. Verify the webhook URL is correct and the secret matches what is shown in your Rootly Grafana integration settings. Use the **Test** button in the contact point configuration to confirm delivery.
Check that the alert rule is in a firing state and that the contact point is set as the notification destination for that rule. Grafana alert rules that use notification policies rather than direct contact point assignment may route differently than expected.
Verify that the `resource_type` and `resource_id` in the notification target URL are correct and that the resource exists in Rootly. Ensure the resource type is one of `User`, `Group`, `EscalationPolicy`, or `Service`.
Confirm the Grafana service account has the **Admin** role — lower roles cannot create snapshots and the workflow task fails silently. Check that the instance URL uses HTTPS and that the service account token has not expired.
## Uninstall
To remove the Grafana integration, open the integrations panel in Rootly and select **Configure > Delete**.
## Related Resources
* [Alert workflows](/workflows/alert-workflows)
* [Alert routing](/alerts/alert-routing)
* [Integrations overview](/integrations/overview)