> ## Documentation Index
> Fetch the complete documentation index at: https://docs.rootly.com/llms.txt
> Use this file to discover all available pages before exploring further.
# On-Call Metrics
> Analyze on-call performance using response time, alert volume, acknowledgement, and escalation metrics to continuously improve reliability and responder health.
## Overview
**On-Call Metrics** give you deep visibility into how effectively your team responds to alerts. These metrics help you understand not just *how many* alerts you receive, but *how quickly* they are acknowledged, *how long* they take to resolve, and *how evenly* response effort is distributed across teams, services, and escalation paths.
Every Rootly workspace includes a **pre-configured On-Call Metrics dashboard** out of the box. This dashboard is designed to surface the most important operational signals immediately, while still allowing full customization as your organization’s needs evolve.
Teams use On-Call Metrics to:
* Identify bottlenecks in alert routing and escalation
* Reduce alert fatigue and uneven on-call load
* Improve responder experience and accountability
* Make data-driven decisions about staffing, schedules, and escalation policies
## Getting Started
To access your on-call analytics, navigate to **Metrics** in the Rootly navigation and select the **On-Call Metrics** dashboard.
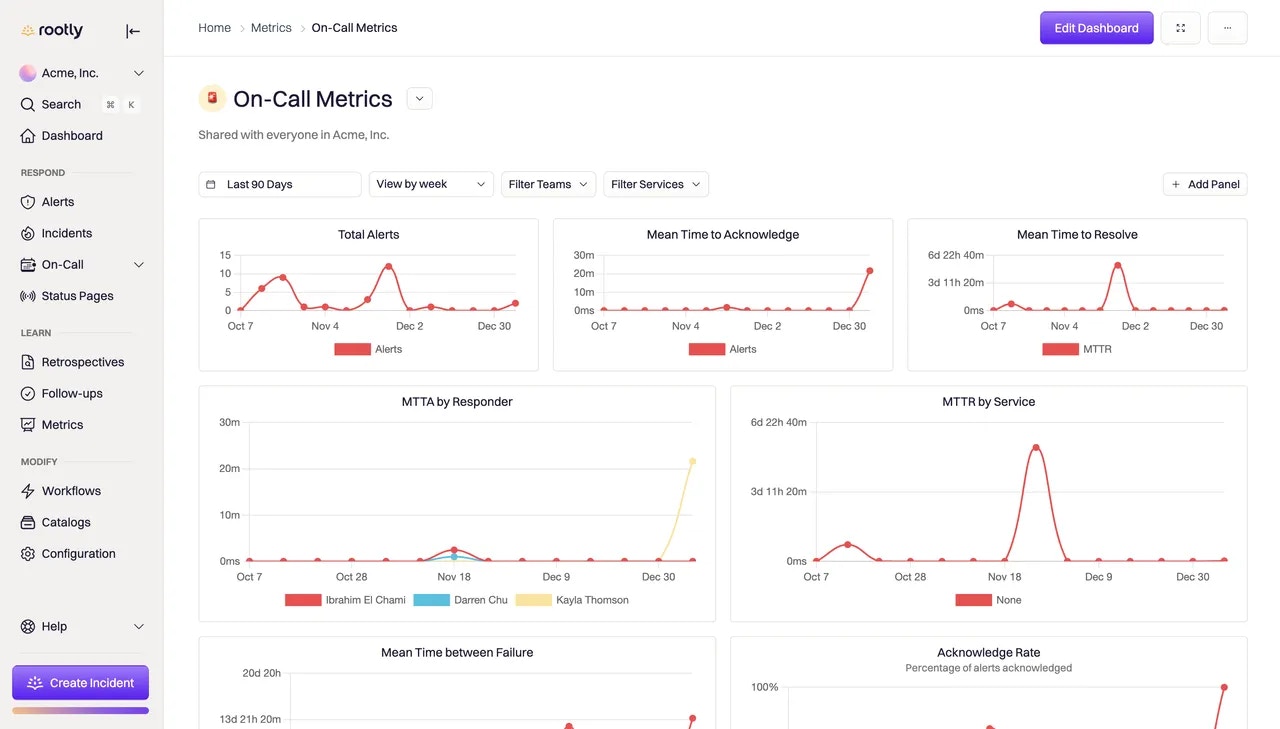 By default, the dashboard displays data for the **last 90 days**, aggregated weekly. You can adjust the time range and aggregation period at any time to zoom in on recent incidents or analyze longer-term trends.
## What the Default Dashboard Measures
The default dashboard focuses on three core areas:
* **Response speed** — how quickly alerts are acknowledged and resolved
* **Response effort** — how much time responders spend handling alerts
* **Alert distribution** — where alerts originate and who handles them
Together, these views provide a holistic picture of on-call performance across your organization.
### Core Response Metrics
These metrics focus on how quickly alerts move through the response lifecycle.
* **Total Alerts**\
The total number of alerts triggered in Rootly during the selected time period. This metric is often used as a baseline to understand alert load and detect spikes caused by deployments, outages, or noisy monitors.
* **Mean Time to Acknowledge (MTTA)**\
The average time between an alert firing and a responder acknowledging it. MTTA reflects notification reachability, escalation effectiveness, and responder availability.
* **Mean Time to Resolve (MTTR)**\
The average time between alert trigger and resolution. This includes investigation, mitigation, and recovery, making it a strong indicator of incident complexity and operational efficiency.
* **Mean Time Between Failures (MTBF)**\
The average time between alert triggers. A decreasing MTBF may signal instability or excessive alerting, while an increasing MTBF often reflects improving reliability.
* **Acknowledge Rate**\
The percentage of alerts that are acknowledged by responders. Lower acknowledge rates can indicate alert fatigue, misconfigured notifications, or routing issues.
### Performance Breakdown
These metrics help you understand *who* is responding and *where* time is being spent.
* **MTTA by Responder**\
Shows how quickly individual responders acknowledge alerts. This can surface timezone mismatches, training gaps, or uneven alert distribution.
* **MTTR by Service**\
Breaks resolution time down by affected service, helping teams identify systems that are consistently harder to recover.
* **Response Effort**\
Represents the total time spent responding to alerts, measured from acknowledgment to resolution. This metric helps quantify operational load and compare effort across teams or services.
### Alert Distribution Insights
Distribution metrics show how alerts flow through your organization.
* **Alerts by Source**\
Highlights which monitoring tools generate the most alerts, helping teams tune integrations and reduce noise.
* **Alerts by Responder**\
Shows how alerts are distributed across individuals, making it easier to identify overload or imbalance in rotations.
* **Alerts by Urgency**\
Breaks alerts down by priority, helping validate whether severity definitions align with real-world response behavior.
* **Alerts by Escalation Policy**\
Reveals which escalation workflows are most active and whether policies are triggering as expected.
* **Alerts by Service**\
Shows where alert volume is concentrated, helping teams prioritize reliability improvements for the most impactful systems.
## Customizing Your Dashboard
The On-Call Metrics dashboard is fully customizable, allowing you to tailor it to what reliability means for your organization.
You can modify existing panels to change time ranges, filters, aggregation methods, or visualization types. This makes it easy to answer targeted questions—such as how response times differ during business hours or how a recent rollout affected alert volume.
You can also add new panels using **alert data** or **incident data**, enabling teams to correlate paging behavior with broader incident trends.
For the most complete view of operational performance, combine **alert-based metrics** with **incident-based metrics** in the same dashboard.
## Sharing and Exporting Metrics
On-call metrics are often valuable beyond the immediate response team. Rootly allows you to export individual panels or entire dashboards for sharing with leadership, stakeholders, or external partners.
Exports can be generated directly from the dashboard using the panel or dashboard menu, making it easy to include on-call performance data in reports, reviews, and postmortems—without manual data collection.
***
## Best Practices
To get the most value from On-Call Metrics:
* Review metrics regularly, not just during incidents
* Use MTTA trends to validate notification reachability and escalation effectiveness
* Monitor MTTR by service to identify systems that need reliability investment
* Watch alert distribution to ensure on-call load is balanced fairly
* Treat metrics as a feedback loop—refine alerting and escalation, then measure again
***
## Frequently Asked Questions (FAQs)
On-Call Metrics are derived directly from **alert and incident events** in your Rootly workspace.\
Metrics such as MTTA, MTTR, and acknowledge rate are calculated using timestamps recorded when alerts are triggered, acknowledged, and resolved. Because the data is event-driven, metrics update automatically as new alerts and incidents occur.
On-Call Metrics only include alerts that are processed through Rootly’s alerting and escalation system.\
If a schedule is not attached to an escalation policy, or an alert source is misconfigured, those alerts may not appear in metrics. Reviewing escalation policies and alert routing is often the first step when counts seem lower than expected.
**Mean Time to Acknowledge (MTTA)** measures how quickly a responder acknowledges an alert after it fires.\
**Mean Time to Resolve (MTTR)** measures how long it takes to fully resolve the issue after the alert is triggered.\
Together, these metrics help distinguish between *notification speed* and *resolution efficiency*.
Response Effort represents the **total time spent actively responding to alerts**, measured from acknowledgment to resolution.\
This metric is useful for understanding operational load and comparing effort across teams or services, even when alert volume is similar.
Yes. Every panel on the On-Call Metrics dashboard can be edited, removed, or duplicated.\
You can also add new panels using alert or incident data to track metrics that are specific to your organization’s reliability goals.
By default, the team owner is granted manager access to the dashboard, and the team is granted edit access.\
Additional permissions can be managed through Rootly’s dashboard sharing and role-based access controls.
Metrics update continuously as new alert and incident events are recorded.\
There is no manual refresh required—changes to alerts, acknowledgements, or resolutions are reflected automatically in the dashboard.
On-Call Metrics focus on **paging and responder behavior**, while Incident Analytics focus on **incident lifecycle and outcomes**.\
For the most complete picture of reliability, Rootly recommends using both together to connect alert response performance with incident impact.
***
**Tip:** Reviewing On-Call Metrics alongside Retrospectives helps connect quantitative performance data with qualitative incident learnings.
By default, the dashboard displays data for the **last 90 days**, aggregated weekly. You can adjust the time range and aggregation period at any time to zoom in on recent incidents or analyze longer-term trends.
## What the Default Dashboard Measures
The default dashboard focuses on three core areas:
* **Response speed** — how quickly alerts are acknowledged and resolved
* **Response effort** — how much time responders spend handling alerts
* **Alert distribution** — where alerts originate and who handles them
Together, these views provide a holistic picture of on-call performance across your organization.
### Core Response Metrics
These metrics focus on how quickly alerts move through the response lifecycle.
* **Total Alerts**\
The total number of alerts triggered in Rootly during the selected time period. This metric is often used as a baseline to understand alert load and detect spikes caused by deployments, outages, or noisy monitors.
* **Mean Time to Acknowledge (MTTA)**\
The average time between an alert firing and a responder acknowledging it. MTTA reflects notification reachability, escalation effectiveness, and responder availability.
* **Mean Time to Resolve (MTTR)**\
The average time between alert trigger and resolution. This includes investigation, mitigation, and recovery, making it a strong indicator of incident complexity and operational efficiency.
* **Mean Time Between Failures (MTBF)**\
The average time between alert triggers. A decreasing MTBF may signal instability or excessive alerting, while an increasing MTBF often reflects improving reliability.
* **Acknowledge Rate**\
The percentage of alerts that are acknowledged by responders. Lower acknowledge rates can indicate alert fatigue, misconfigured notifications, or routing issues.
### Performance Breakdown
These metrics help you understand *who* is responding and *where* time is being spent.
* **MTTA by Responder**\
Shows how quickly individual responders acknowledge alerts. This can surface timezone mismatches, training gaps, or uneven alert distribution.
* **MTTR by Service**\
Breaks resolution time down by affected service, helping teams identify systems that are consistently harder to recover.
* **Response Effort**\
Represents the total time spent responding to alerts, measured from acknowledgment to resolution. This metric helps quantify operational load and compare effort across teams or services.
### Alert Distribution Insights
Distribution metrics show how alerts flow through your organization.
* **Alerts by Source**\
Highlights which monitoring tools generate the most alerts, helping teams tune integrations and reduce noise.
* **Alerts by Responder**\
Shows how alerts are distributed across individuals, making it easier to identify overload or imbalance in rotations.
* **Alerts by Urgency**\
Breaks alerts down by priority, helping validate whether severity definitions align with real-world response behavior.
* **Alerts by Escalation Policy**\
Reveals which escalation workflows are most active and whether policies are triggering as expected.
* **Alerts by Service**\
Shows where alert volume is concentrated, helping teams prioritize reliability improvements for the most impactful systems.
## Customizing Your Dashboard
The On-Call Metrics dashboard is fully customizable, allowing you to tailor it to what reliability means for your organization.
You can modify existing panels to change time ranges, filters, aggregation methods, or visualization types. This makes it easy to answer targeted questions—such as how response times differ during business hours or how a recent rollout affected alert volume.
You can also add new panels using **alert data** or **incident data**, enabling teams to correlate paging behavior with broader incident trends.
For the most complete view of operational performance, combine **alert-based metrics** with **incident-based metrics** in the same dashboard.
## Sharing and Exporting Metrics
On-call metrics are often valuable beyond the immediate response team. Rootly allows you to export individual panels or entire dashboards for sharing with leadership, stakeholders, or external partners.
Exports can be generated directly from the dashboard using the panel or dashboard menu, making it easy to include on-call performance data in reports, reviews, and postmortems—without manual data collection.
***
## Best Practices
To get the most value from On-Call Metrics:
* Review metrics regularly, not just during incidents
* Use MTTA trends to validate notification reachability and escalation effectiveness
* Monitor MTTR by service to identify systems that need reliability investment
* Watch alert distribution to ensure on-call load is balanced fairly
* Treat metrics as a feedback loop—refine alerting and escalation, then measure again
***
## Frequently Asked Questions (FAQs)
On-Call Metrics are derived directly from **alert and incident events** in your Rootly workspace.\
Metrics such as MTTA, MTTR, and acknowledge rate are calculated using timestamps recorded when alerts are triggered, acknowledged, and resolved. Because the data is event-driven, metrics update automatically as new alerts and incidents occur.
On-Call Metrics only include alerts that are processed through Rootly’s alerting and escalation system.\
If a schedule is not attached to an escalation policy, or an alert source is misconfigured, those alerts may not appear in metrics. Reviewing escalation policies and alert routing is often the first step when counts seem lower than expected.
**Mean Time to Acknowledge (MTTA)** measures how quickly a responder acknowledges an alert after it fires.\
**Mean Time to Resolve (MTTR)** measures how long it takes to fully resolve the issue after the alert is triggered.\
Together, these metrics help distinguish between *notification speed* and *resolution efficiency*.
Response Effort represents the **total time spent actively responding to alerts**, measured from acknowledgment to resolution.\
This metric is useful for understanding operational load and comparing effort across teams or services, even when alert volume is similar.
Yes. Every panel on the On-Call Metrics dashboard can be edited, removed, or duplicated.\
You can also add new panels using alert or incident data to track metrics that are specific to your organization’s reliability goals.
By default, the team owner is granted manager access to the dashboard, and the team is granted edit access.\
Additional permissions can be managed through Rootly’s dashboard sharing and role-based access controls.
Metrics update continuously as new alert and incident events are recorded.\
There is no manual refresh required—changes to alerts, acknowledgements, or resolutions are reflected automatically in the dashboard.
On-Call Metrics focus on **paging and responder behavior**, while Incident Analytics focus on **incident lifecycle and outcomes**.\
For the most complete picture of reliability, Rootly recommends using both together to connect alert response performance with incident impact.
***
**Tip:** Reviewing On-Call Metrics alongside Retrospectives helps connect quantitative performance data with qualitative incident learnings.