


.svg)


.svg)


Documentation Index
Fetch the complete documentation index at: https://docs.rootly.com/llms.txt
Use this file to discover all available pages before exploring further.
Introduction
The Grafana integration connects Rootly with your Grafana instance so teams can capture dashboard and panel snapshots directly from incident workflows. This provides point-in-time visibility into your metrics during an incident without leaving the incident response flow. With the Grafana integration, you can:- Capture Grafana dashboard snapshots from Genius workflows during incidents
- Capture individual panel snapshots for targeted metric visibility
- Attach snapshot links to incident timelines for post-incident review
- Ingest Grafana alert events into Rootly as alerts — see the Alerts page for setup
Before You Begin
Before setting up the integration, make sure you have:- A Rootly account with permission to manage integrations
- A Grafana instance accessible over HTTPS
- Permission to create service accounts in Grafana
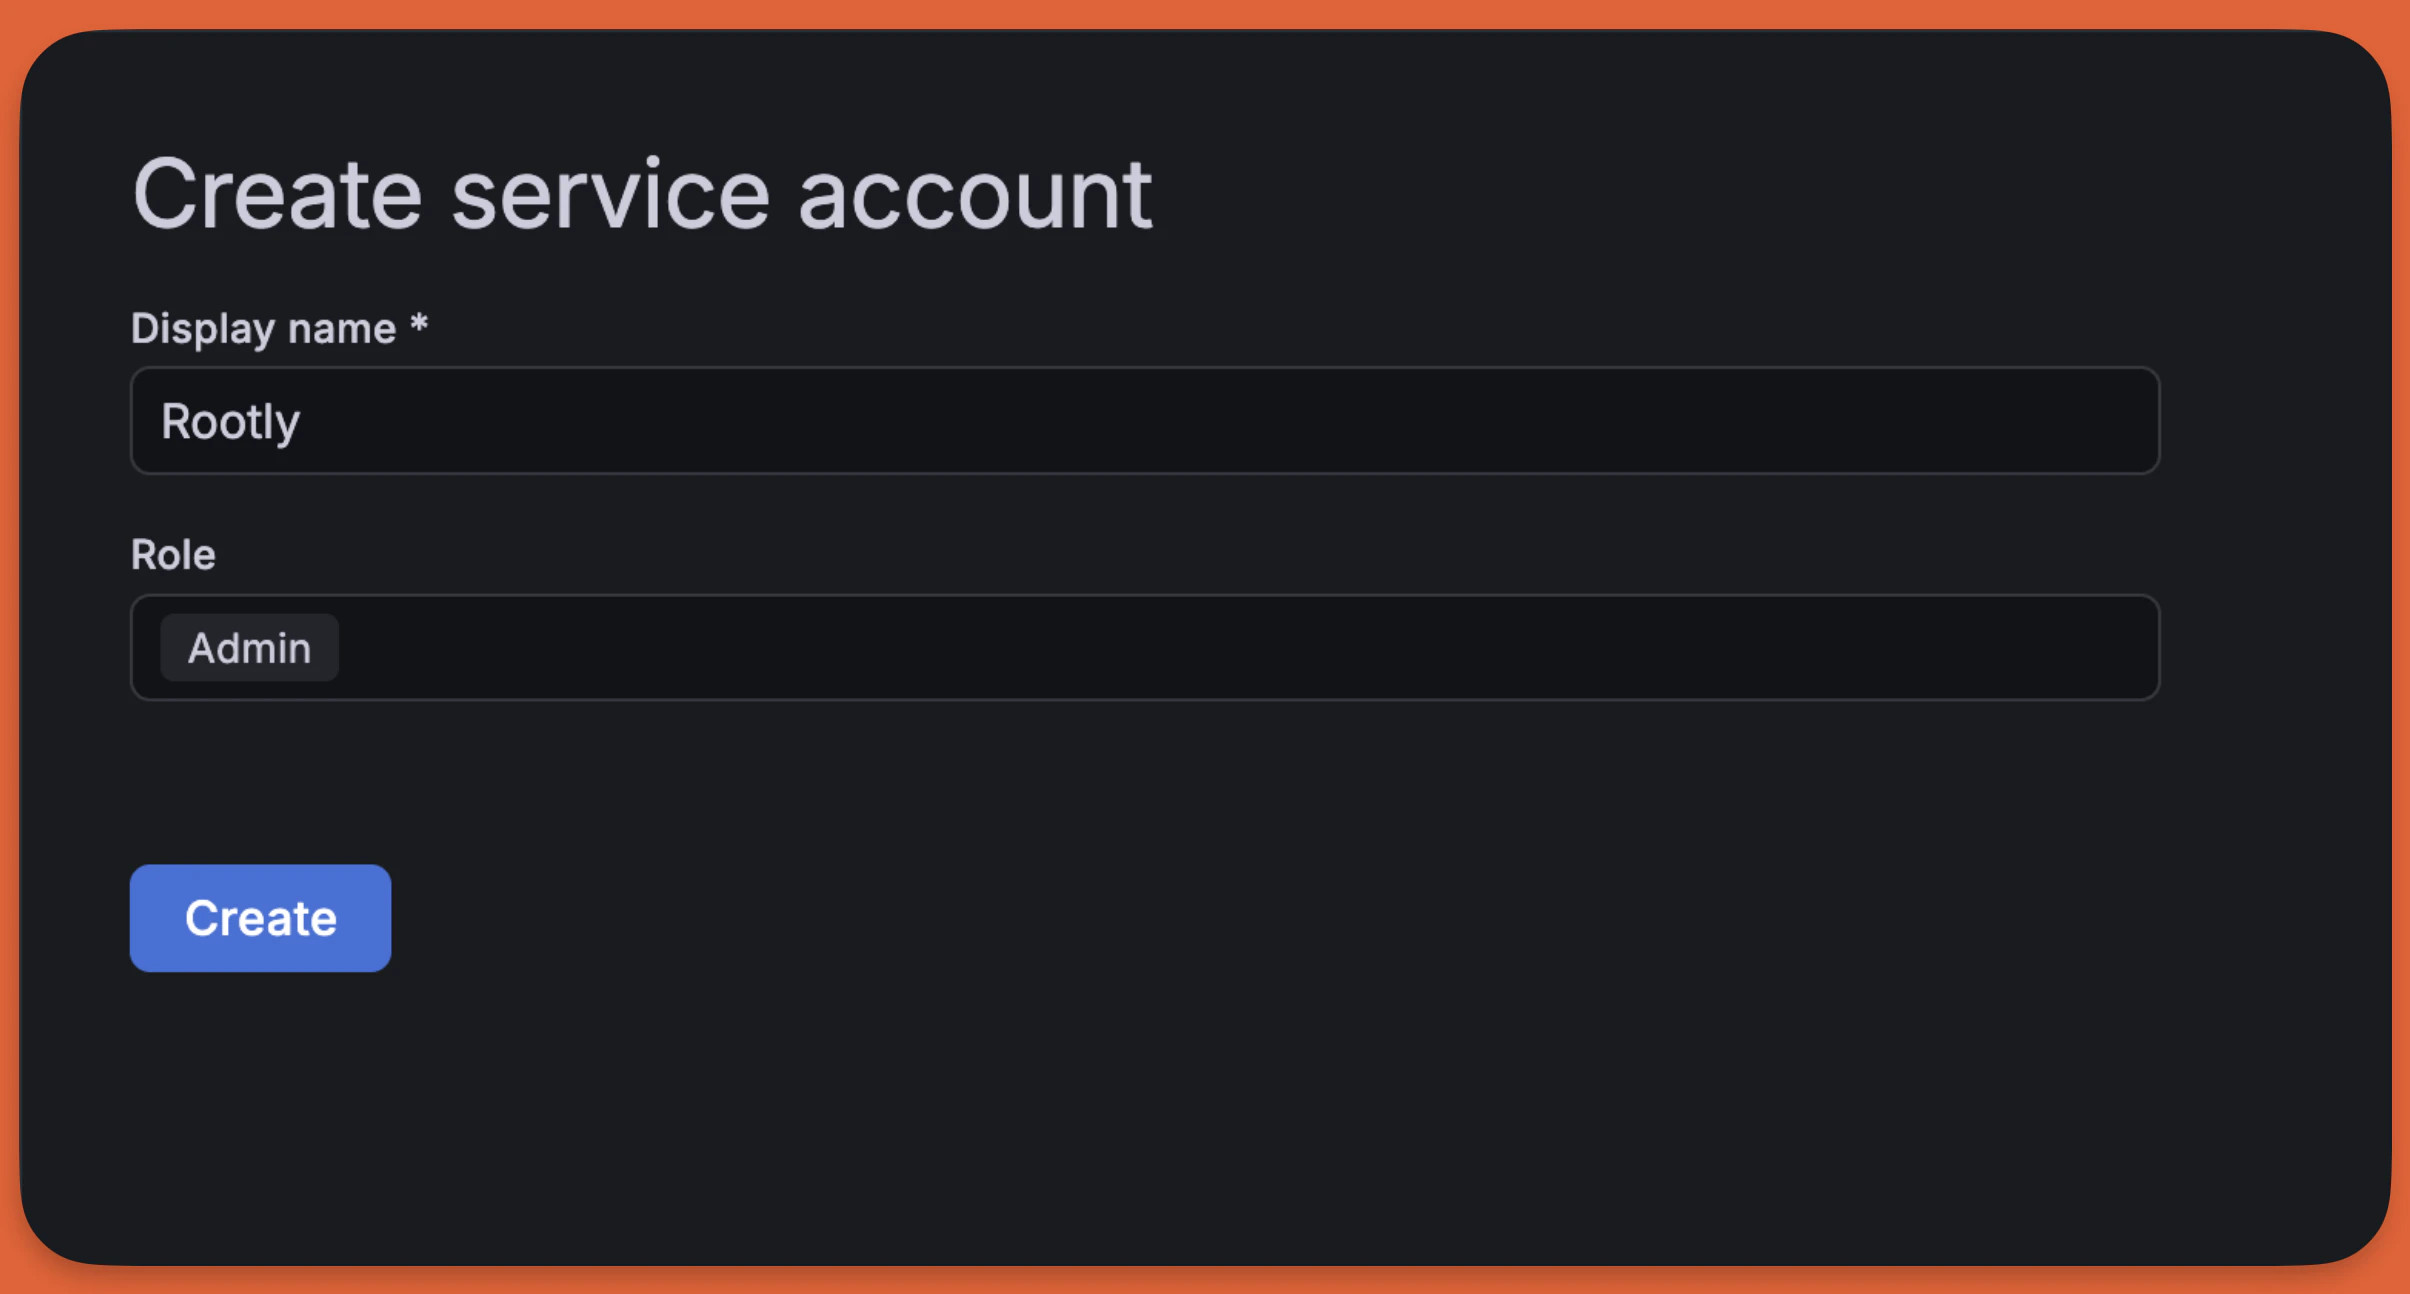
Rootly requires a Grafana service account with an Admin role to create dashboard snapshots. We recommend a dedicated service account so the integration does not break if an individual user leaves your organization.
Installation
Open the Grafana integration in Rootly
Navigate to the integrations page in Rootly and select Grafana.
Create a service account in Grafana
In your Grafana instance, navigate to Administration > Service Accounts.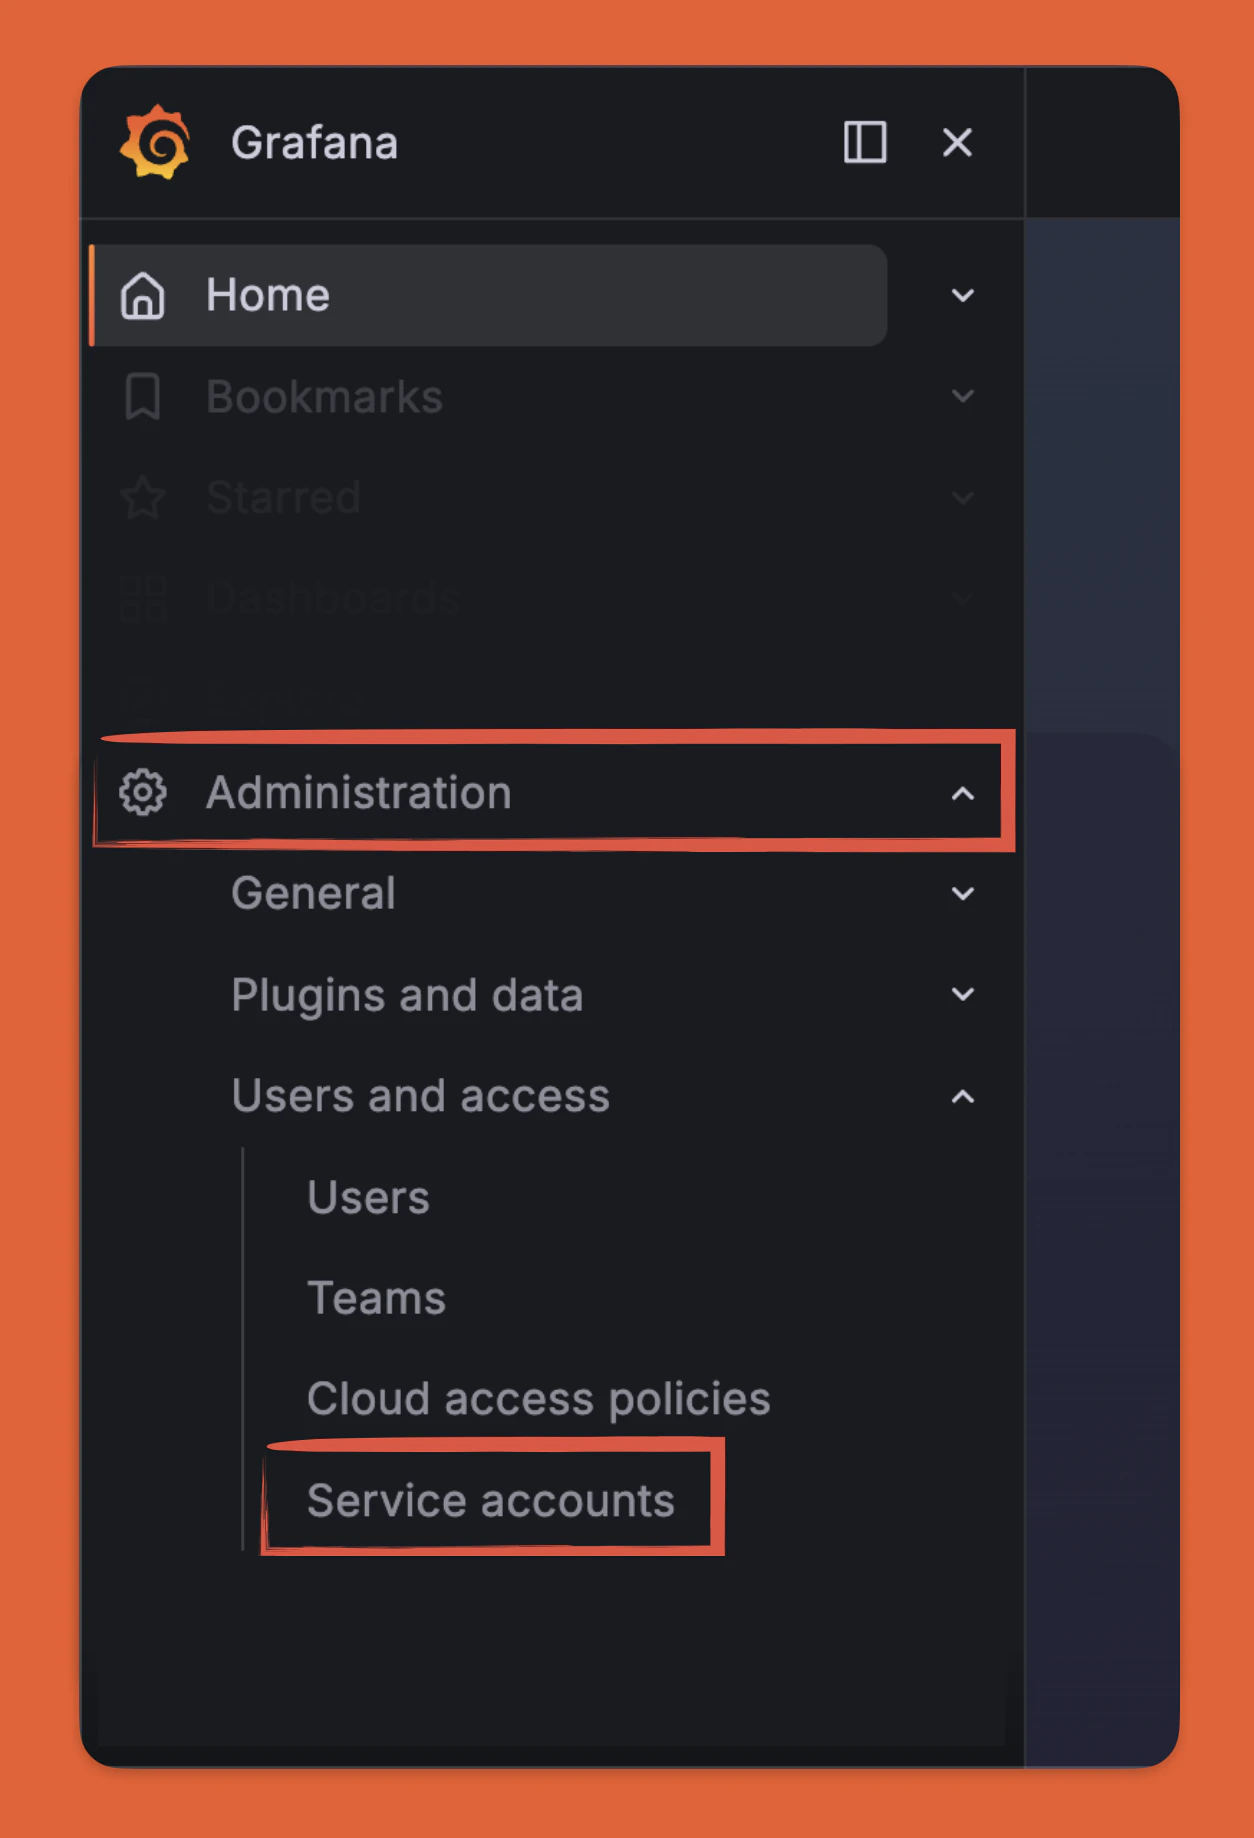
Grafana service accounts with roles lower than Admin cannot create snapshots. The integration will fail silently if the role is insufficient.
Generate a service account token
Open the service account and select Add Service Account token. Enter a display name, set the token expiration, and generate the token.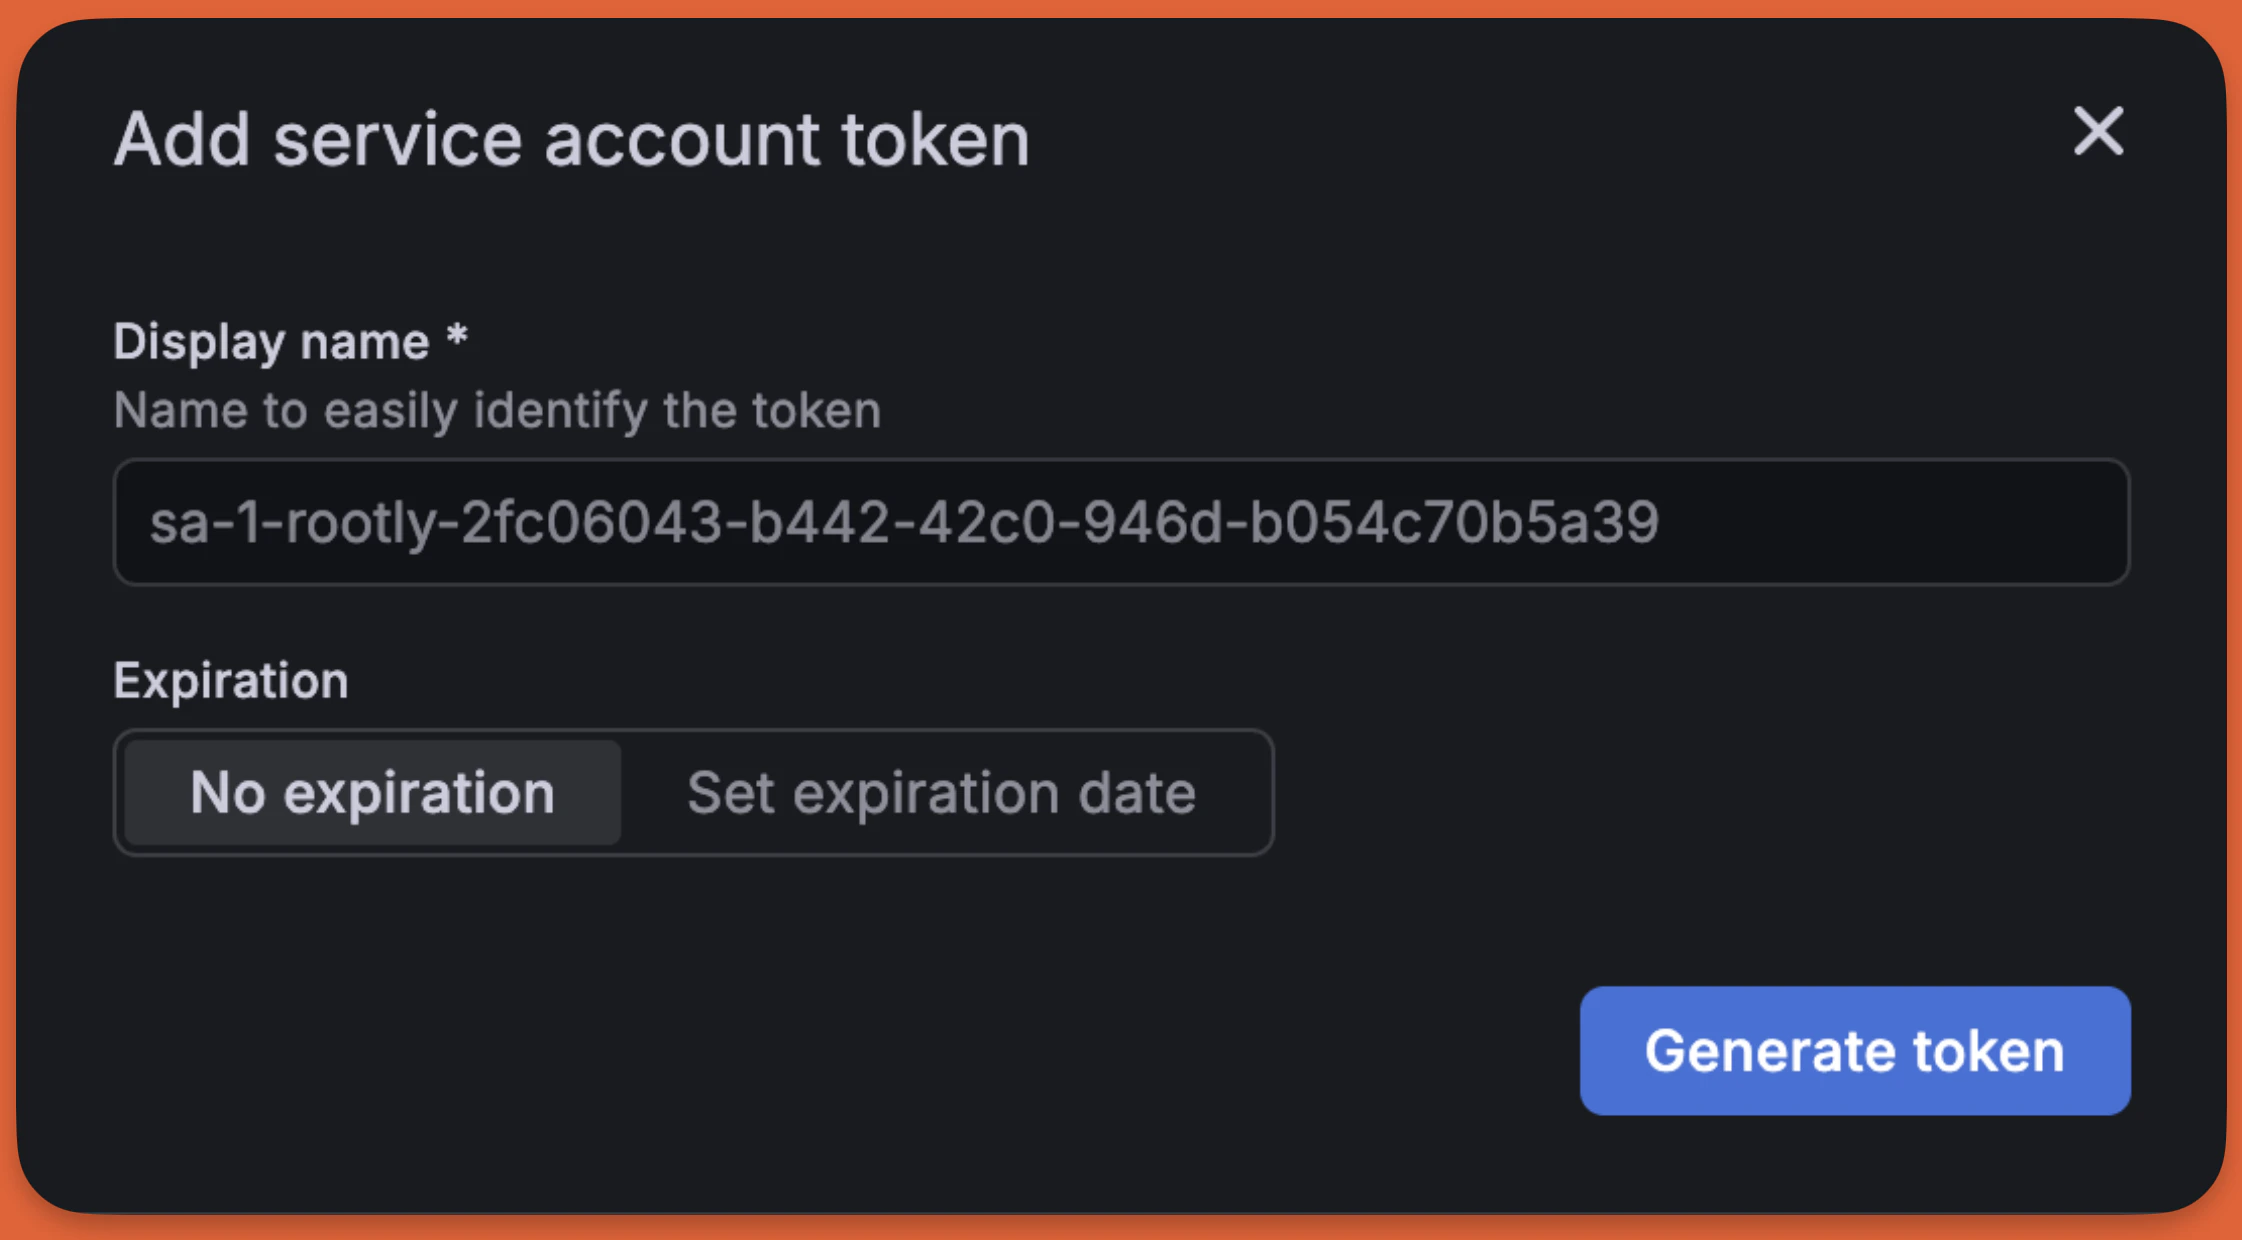
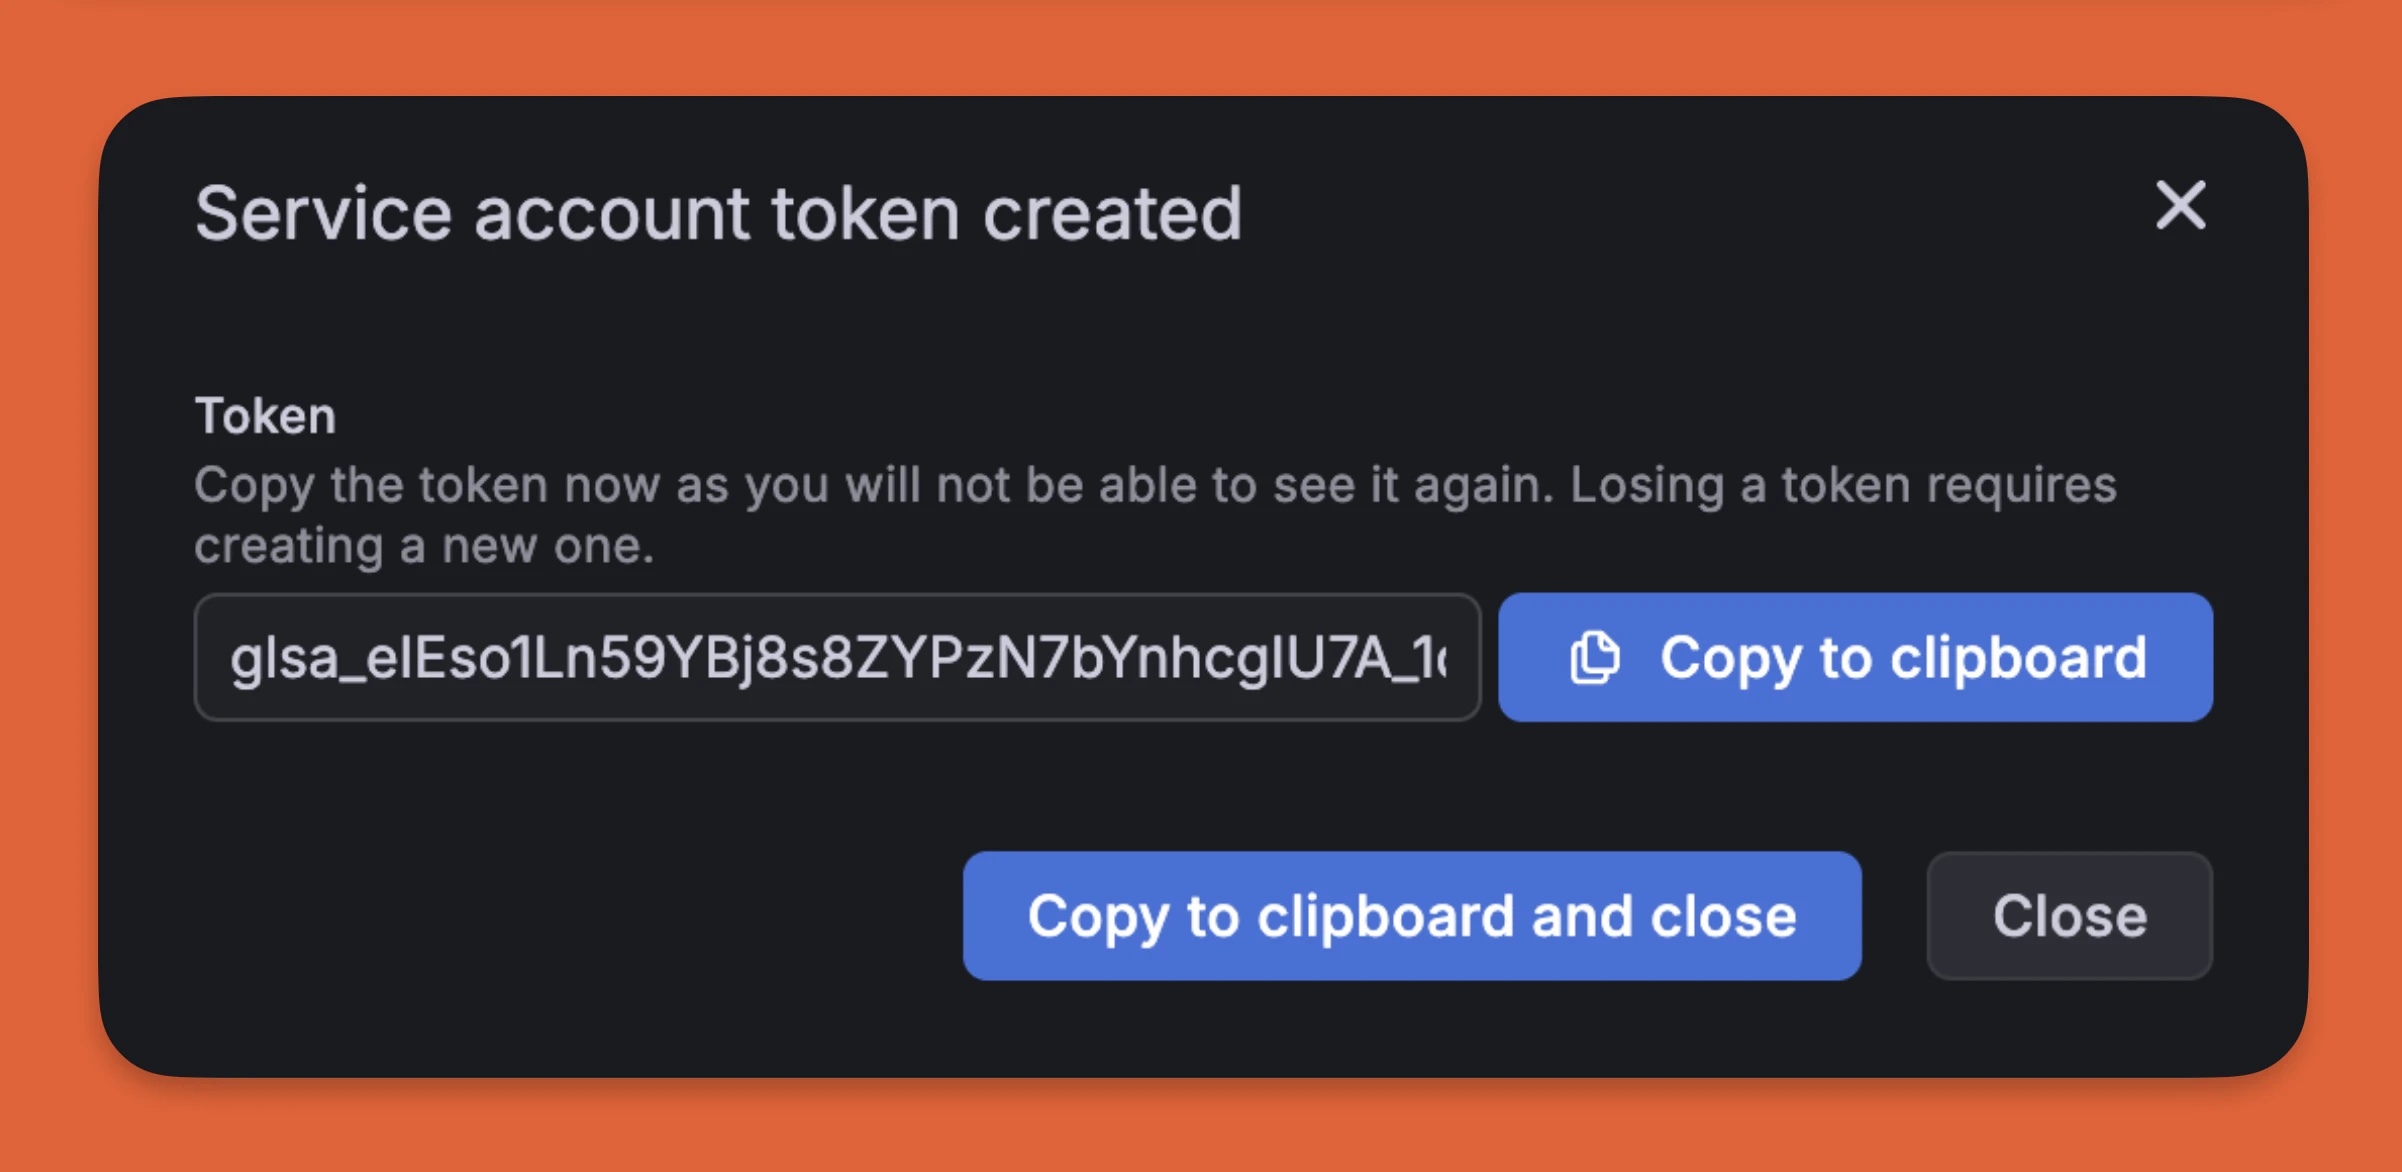
Copy the token immediately — Grafana will not show it again after you leave this page.

Capture Snapshots in Workflows
Once the integration is connected, two new tasks are available in your Genius workflows:- Capture Grafana Dashboard Snapshot — captures a snapshot of a full dashboard
- Capture Grafana Panel Snapshot — captures a snapshot of a specific panel
Snapshots are point-in-time captures. The snapshot link is attached to the incident timeline so you can reference exactly what your dashboards looked like when the incident occurred.